In his 1983 patent, Puharich describes his water splitting technique as being a multi-stage water treatment process.
The stages of this process are summarized below:
Stage A: Dry charging the cell to test integrity of all components and to clean cell surfaces with high voltage electrostatic charge.
Stage B: (which has 5 phases)
B.1: Water is added to the cell but not so high as to close the circuit.
B.2: Water is added drop by drop until the circuit is closed as it connects non-insulated surfaces of the cell.
B.3: The resonant frequency of the carrier drops, voltage and current drop, and sine wave from Stage A is changed to a rippled square wave. Puharich says this happens because of water’s changing RC constant from treatment. According to Puharich, the frequency of the rippled square wave at this stage is a function of its entrainment with water’s nuclear spin relaxation constant (tau=3.0 sec). Also, at this phase Puharich says that the square wave exhibits higher order harmonics, each relating to the specific resonances of the water molecule’s atoms.
B.4: When the water becomes highly polarizes, the waveform exhibits complete half-wave rectification. Slight electrolysis is evident by the appearance of a faint vapor.
Something else interesting happens at this stage. The reverse threshold is met. This can be tested by opening the circuit once again by removing some of the water in the cell until the water level falls below the cathode’s insulation line. Voltage and current will then drop to zero, and the rippled square wave will disappear, but it will give way to positive uni-polar pulses occurring within the water itself.
B.5: Through the process given above, the water is reshaped into a more rigid, higher energy state exhibiting a tetrahedral conformation given by a bond angle shift from 104 degrees to 109 degrees and 28 minutes. According to Puharich, it is only at this point that resonance can be applied to bring about thermodynamically efficient water splitting.
Stage C: A new waveform is generated that matches the effects seen during stage B. This causes the rippled square wave to give way to a rippled sawtooth wave and the appearance of 4 higher order harmonics:
Carrier frequency: 3980Hz
OHM1: 7960Hz
OHM2: 15,920Hz
OHM3: 31,840Hz
OHM4: 63,690Hz
These higher order harmonics indicate the resonance during efficient electrolysis of each apice of the water molecule in its tetrahedral conformation.
Puahrich states that gas being formed using this method exhibits a visible centripetal “pearl chain formation” that looks like the “spokes of a wheel” in the cell.
Stage D:
Rapid hydrolysis slows as a barrier potential is formed after about 27 minutes of operation.
Stage E:
A barrier to the operation of the effect arises as the result of microscopic gas bubbles forming on the cell plates.
Stage F:
Mechanical vibration (tapping) can be used to “shake the bubbles free” and clear the plates for continued operation.
What follows is a demonstration of Puharich’s Stage A.
Puharich described his apparatus with the following block diagram: 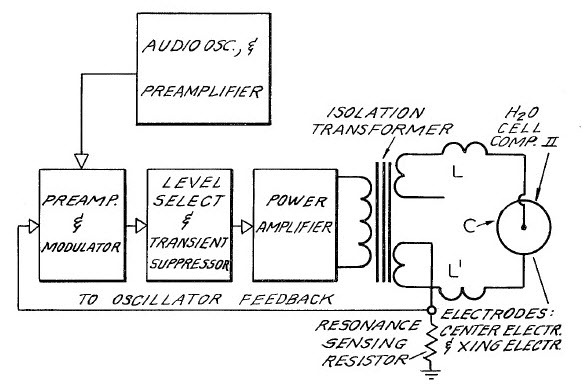 I am using the following configuration in my testing.
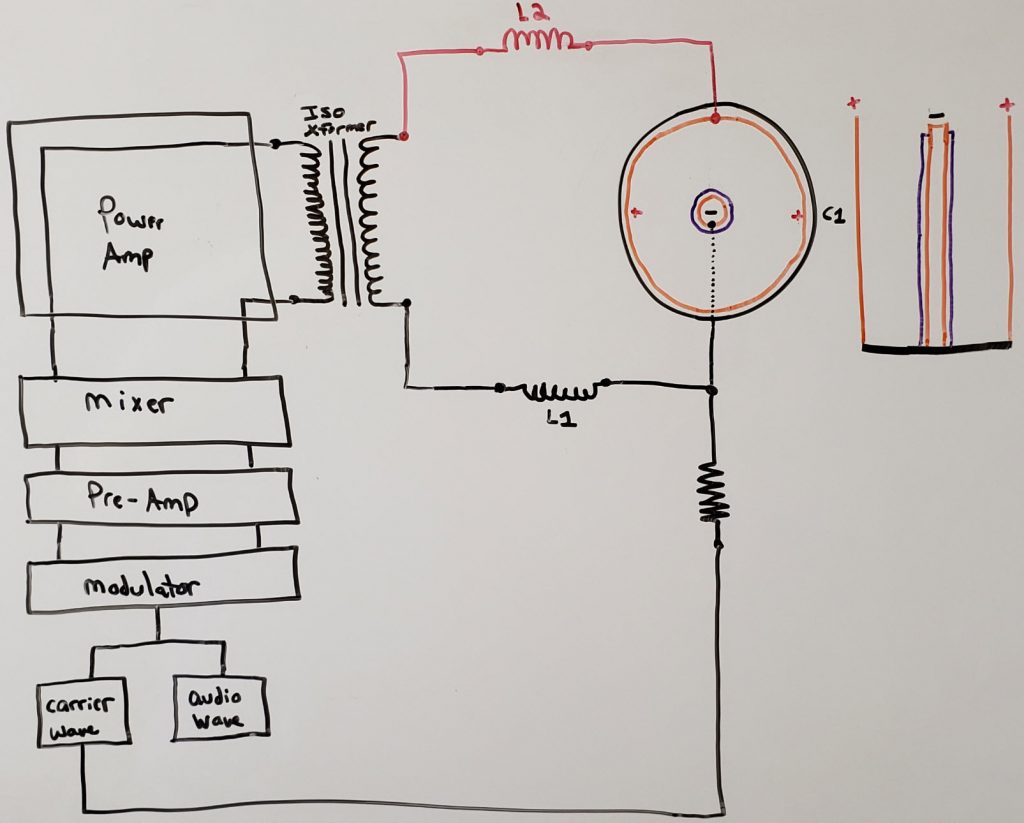
The waveform input is produced using a circuit I have built for this purpose. This circuit generates the carrier wave frequency, the audio wave frequency, manages the amplitude modulation, and handles the cycling amplitude ramp-up and ramp-down all as described in the patent.
The mixer (level select) I am using is a Mackie 1402 VLZ. Each of the first 6 channel strips have their own built in pre-amp. I am amplifying a 2 Vpp input to a 5 Vpp output at this stage.
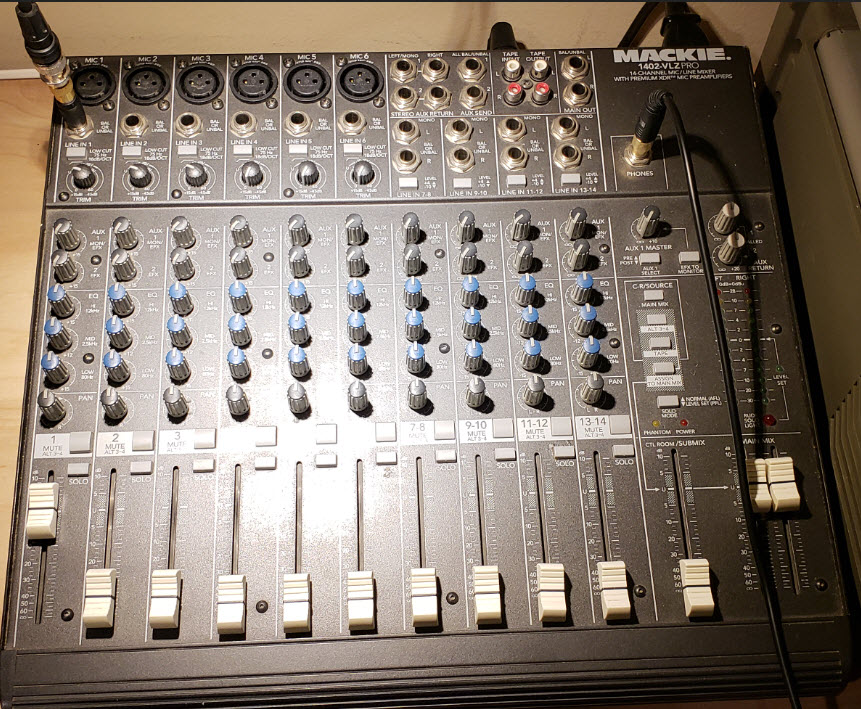
This pre-amplifier has a frequency response of:
+0, -1dB, 20Hz to 50kHz
+0, -3dB, <10Hz, 50kHz up to 100kHz
The power amp I am using is a QSC RMX 2450 capable of 1300W of output in bridged mono mode. Here, I am amplifying a 5 Vpp up to an output of 250 Vpp
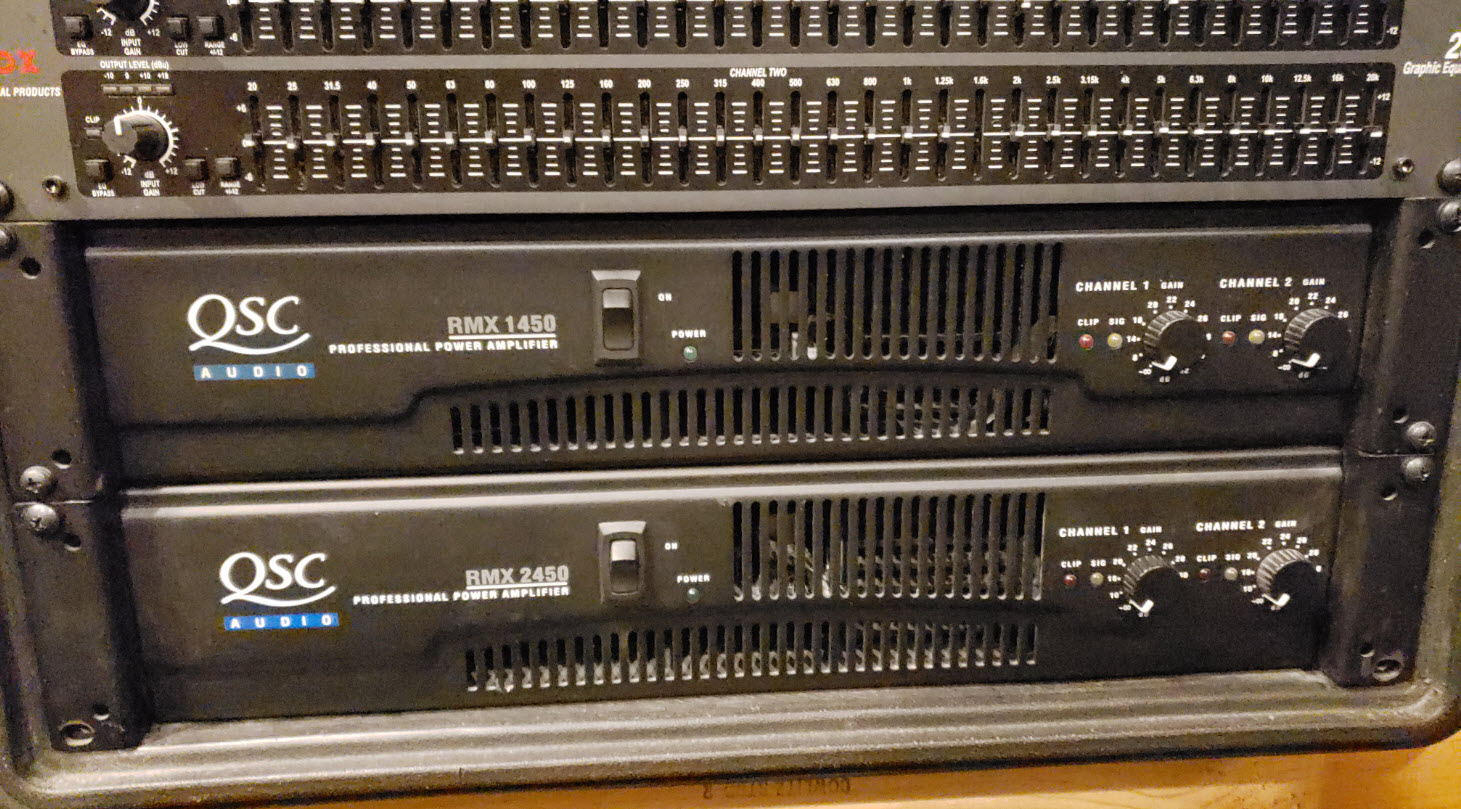
This amplifier has a frequency response of:
20 Hz – 20 kHz: +0/-1 dB
-3 dB at 5 Hz and 50 kHz
-5 dB at 100 kHz
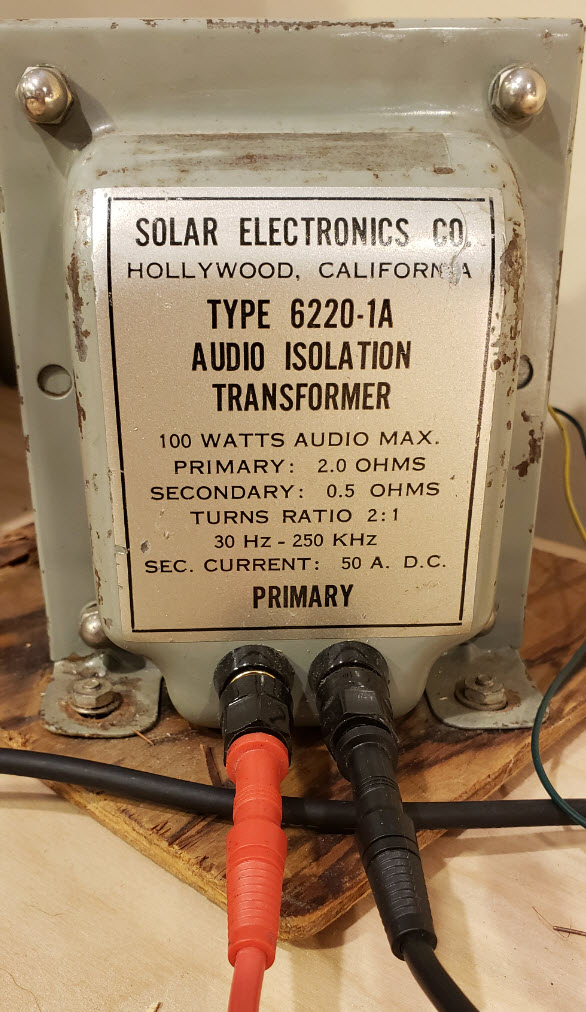
Below is the isolation transformer I am using:
Puharich’s water capacitor, as described in his patent, looks as shown below: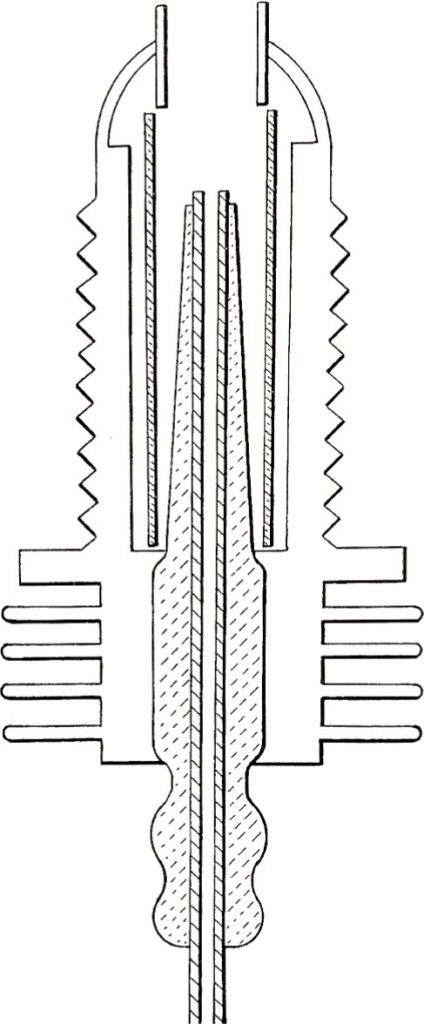
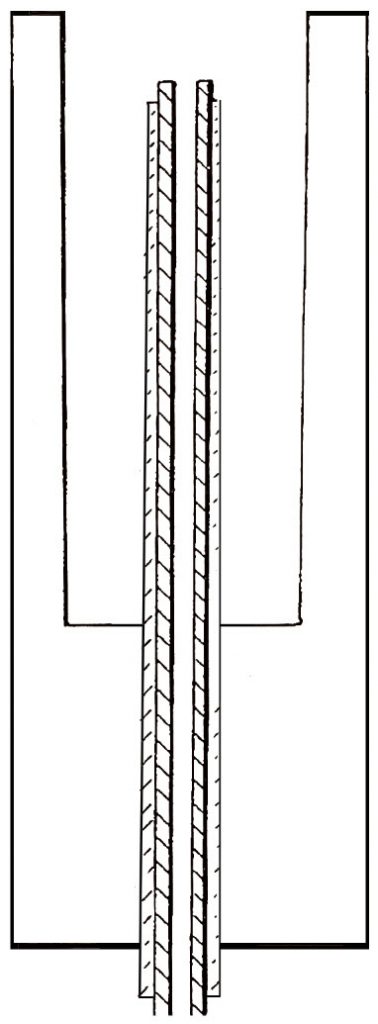
For the purposes of testing, I have reduced the cell’s complexity by removing various features including it’s heat dissipation fins, glass tubes, and the asymmetric, conical electrical insulator around the cathode. Puharich’s purpose for the conical insulator is to slowly shift the polarity of the water as one fills the cell drop by drop. As the cell fills, the water feels the cathodes polarity gradually more and more because of the angle of the insulator along the vertical axis of the cathode. The reason for the glass tubes in Puharich’s cell is to better enable the collection and routing of derived gases for the purpose of making precise energy output measurements.
With the simplifications I have made, the cell I am now testing may be understood as shown below:
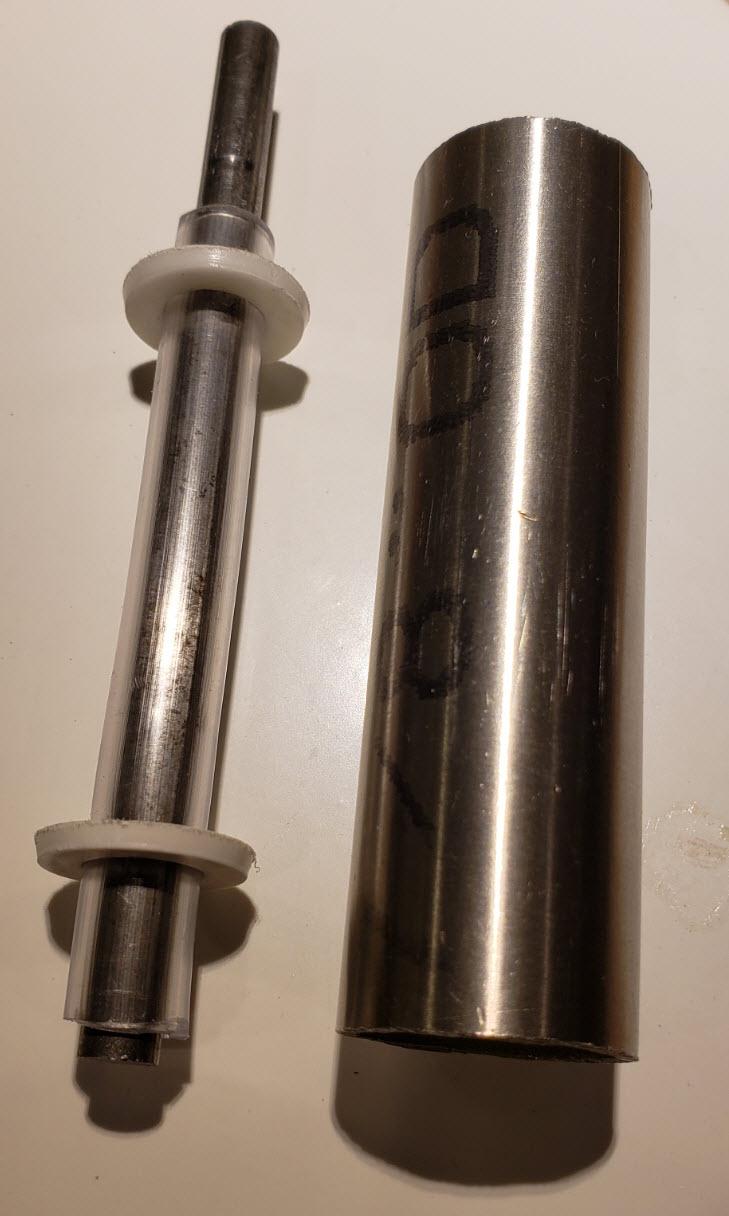
The disassembled physical implementation of this cell is shown below:
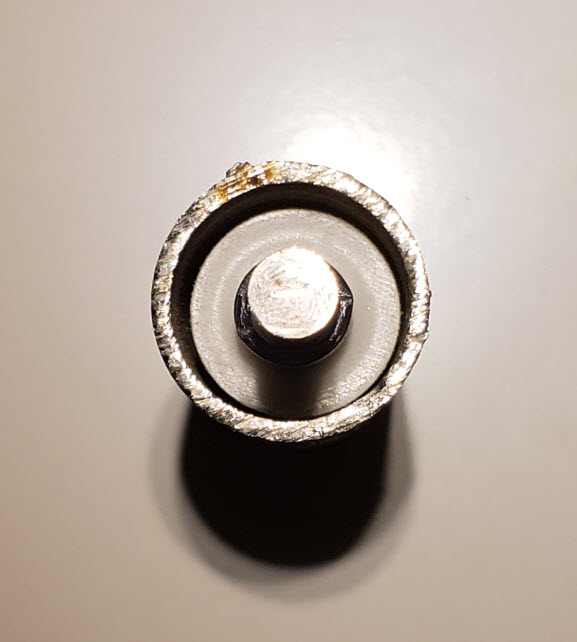
As seen from the top, the assembled cell looks like this:
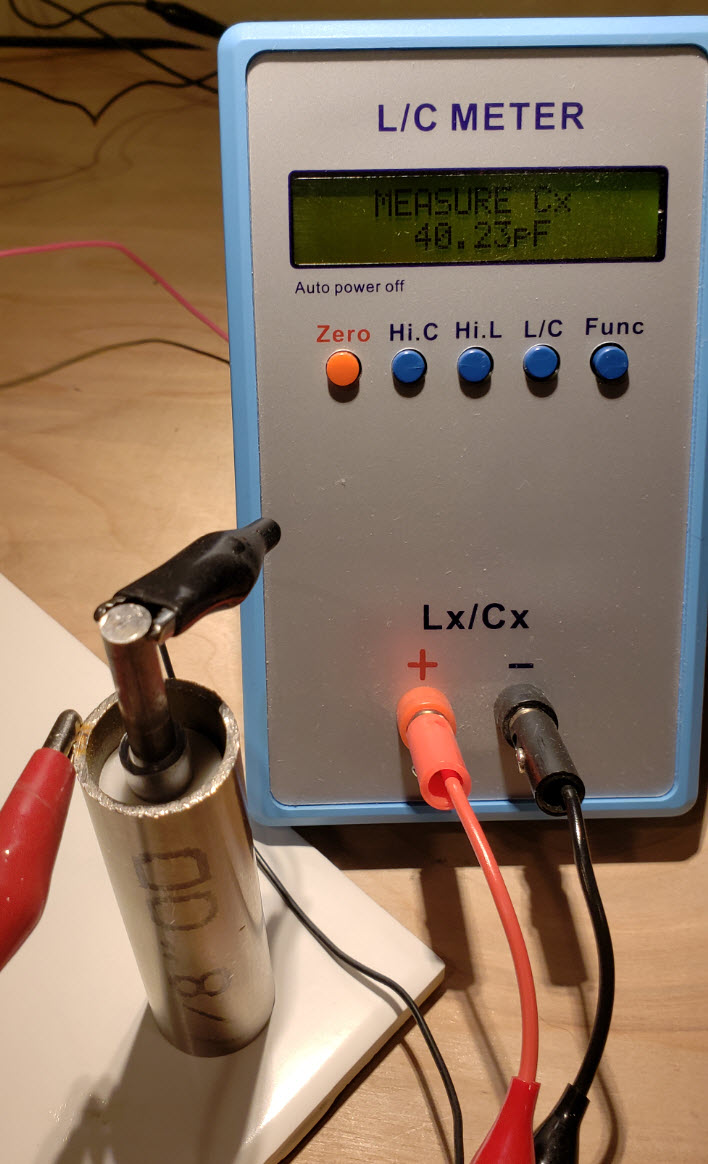
The capacitance of this cell is ~40.23pF:
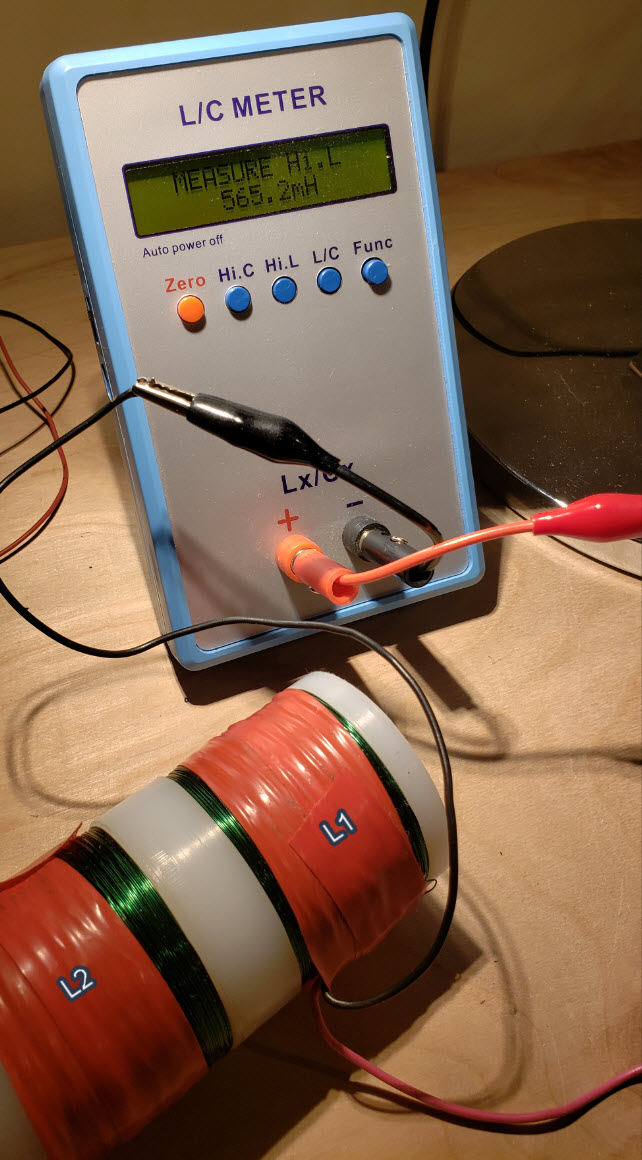
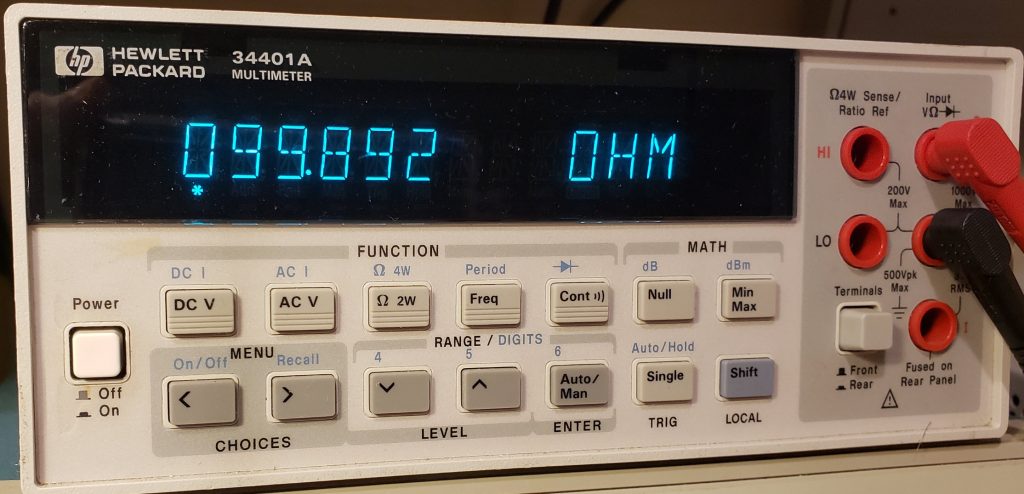
The inductors on either side of the cell (coils built by my friend Russ Gries), L1 and L2, have the following characteristics.
L1: 565.2 mH
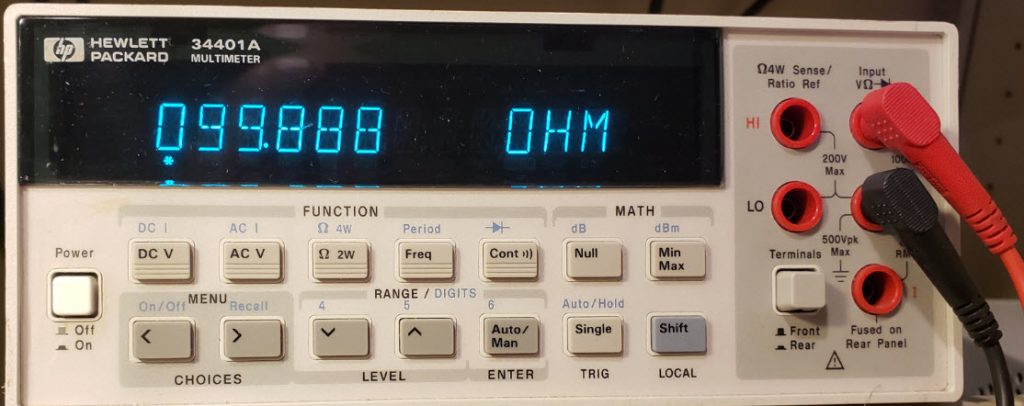
L1: ~100 Ohms DC Resistance
L2: 565.2 mH
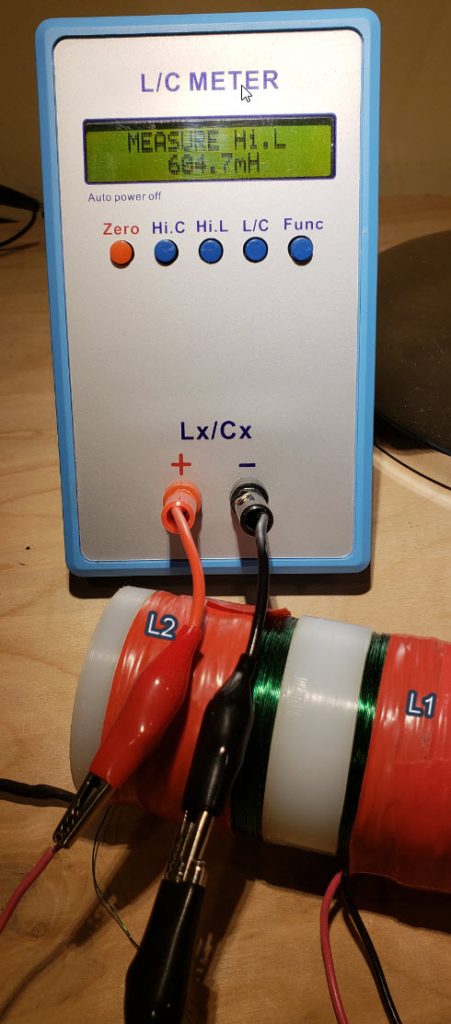
L2: ~100 Ohms DC Resistance
The calculated resonant frequency (f_r)
f_r = 1 * (2pi * (LC)^1/2)^-1
L = 0.5652 H
C = 4.02*10^-11 F
f_r = ~33.38 kHz
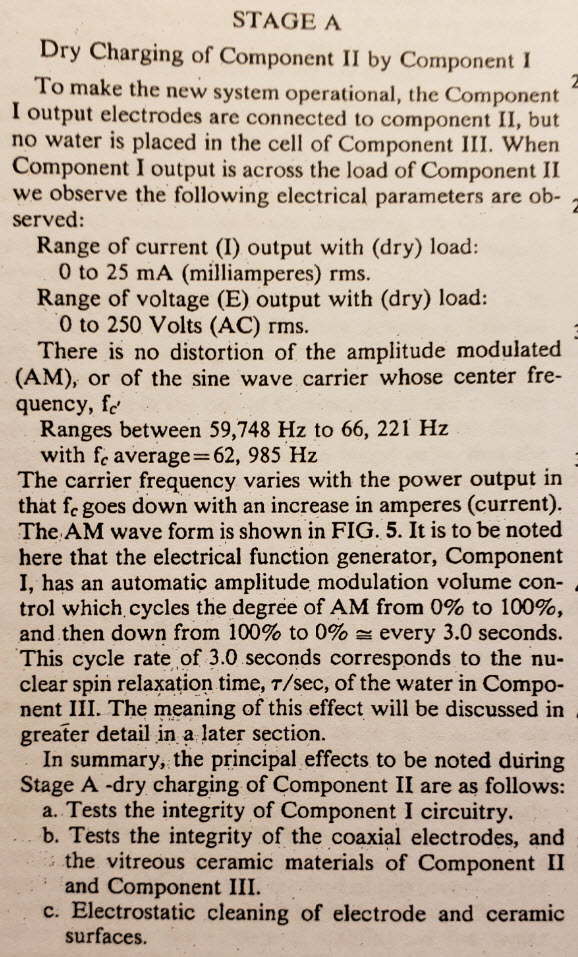
According to Puharich, Stage A of the process is dry charging as described below:
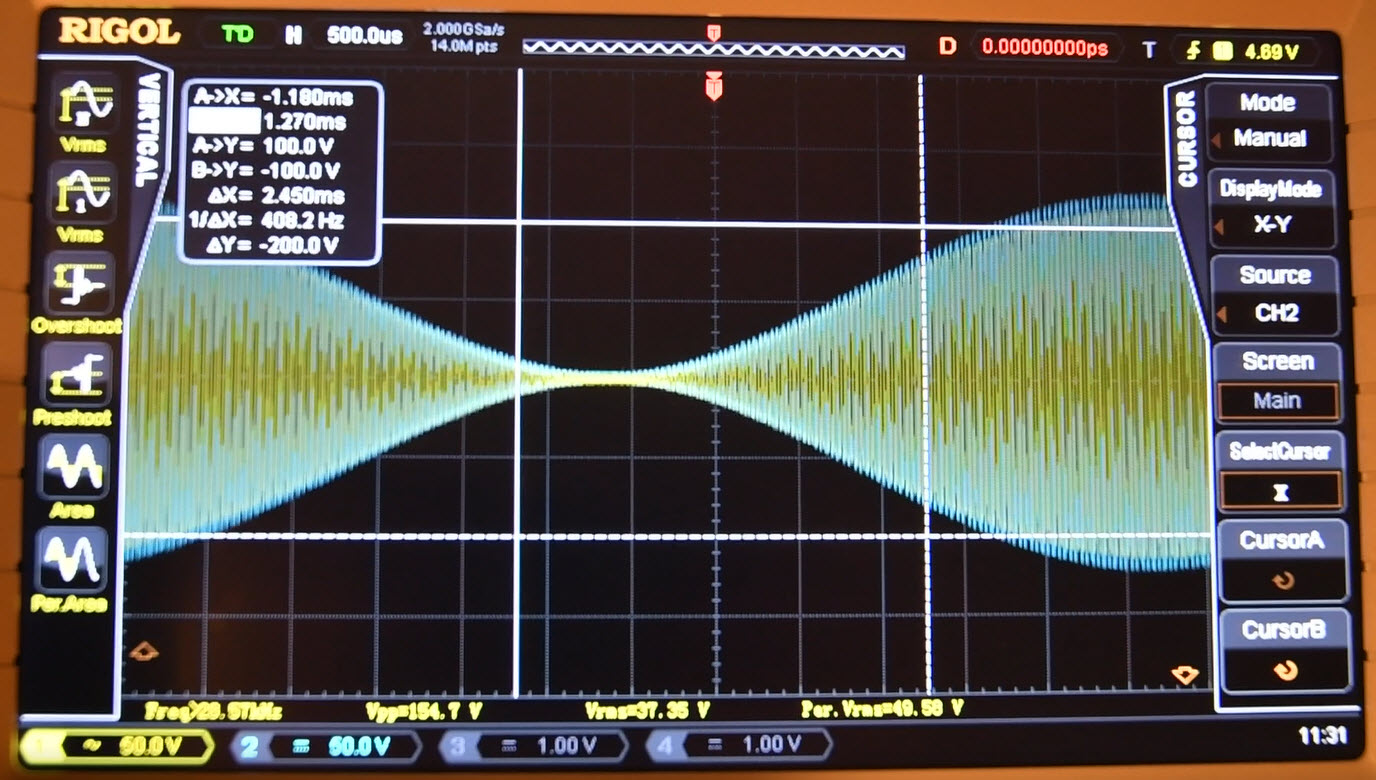
In my results, the actual resonant frequency was ~29 kHz where the voltage (E) on the dry cell rose from 0 to ~240 Vpp and where the max current (I) fluctuated from 0 to ~870mA.
In the above video, the analog scope is showing the 5V output from the pre-amp. The digital scope is showing the amplified signal on both sides of the cell. The yellow trace is on the cathode, the blue trace is on the anode. These traces are superimposed on one another.
As a next step, I want to:
(1) decrease the Stage A current down towards Puharich’s guidance of 25mA (I)
(2) increase Stage A voltage up to 250 Vrms (E)
(3) increase Stage carrier frequency closer to 62kHz
These 3 goals are achievable by:
(1) building a cell with a wider gap between the plates
(2) adjusting the inductance of L1 and L2
Demonstrations of stages B through F to come.
.:.
Hi Alex – a few years ago you had a website which included The Periodic Table of Light, Endless Octaves of Light, etc. Part of the basis of NOE Theory includes these files which I fortunately had downloaded. We are starting a research project at Cambridge University in the UK on Quantum Energy. I am hoping you could put your website back up in the original state and make any necessary corrections to your work for access by the scientists. To verify my work please go to the following link https://noe-theory.com/high_def_graphics/
You will see your work on some of the graphics; The Secret Doctrine Volume IV, page 166, the Attachments at the back of the book, and in the Bibliography:
356. Petty, A., The Music of Matter (2011)
357. Petty, A., Endless Octaves of Light (2011)
358. Petty, A., The Periodic Table of Light (2014)
Please let me know if you can do this.
Please contact me so we can discuss it. I have been working to publish a text that contains an updated form of these materials, however, I can repost these earlier works in their previous form if that helps you. Please let me know.
Warm regards,
Alex Petty
I also have
355. Petty, A., Energy and Harmonics (2009)