Hydrogen Fracturing Technology Overview Chart
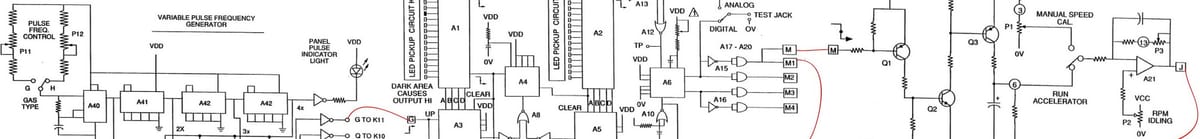
The large diagram below illustrates the relationships between the various components that make up Meyer’s Hydrogen Fracturing technology.
This chart was assembled directly from the figures contained in Meyer’s patents describing the Gas Management System (GMS). When studying those patents carefully, one notices that the various circuits, control systems, and energy conversion components are often presented in separate figures. Each figure describes a piece of the overall system, but the patents rarely show how all of the parts fit together in a single view.
While reviewing these figures it became clear to me that many of the subsystems are designed to operate together as a coordinated whole. The pulse generation circuits, the resonant charging components, the gas processing stages, and the control electronics all appear to form a tightly coupled architecture.
Because this relationship is not always obvious when the diagrams are viewed individually, I decided to map the components together into one unified overview. The goal of this chart is to make the interactions between the various subsystems explicit so that the overall structure of the technology can be seen at a glance.
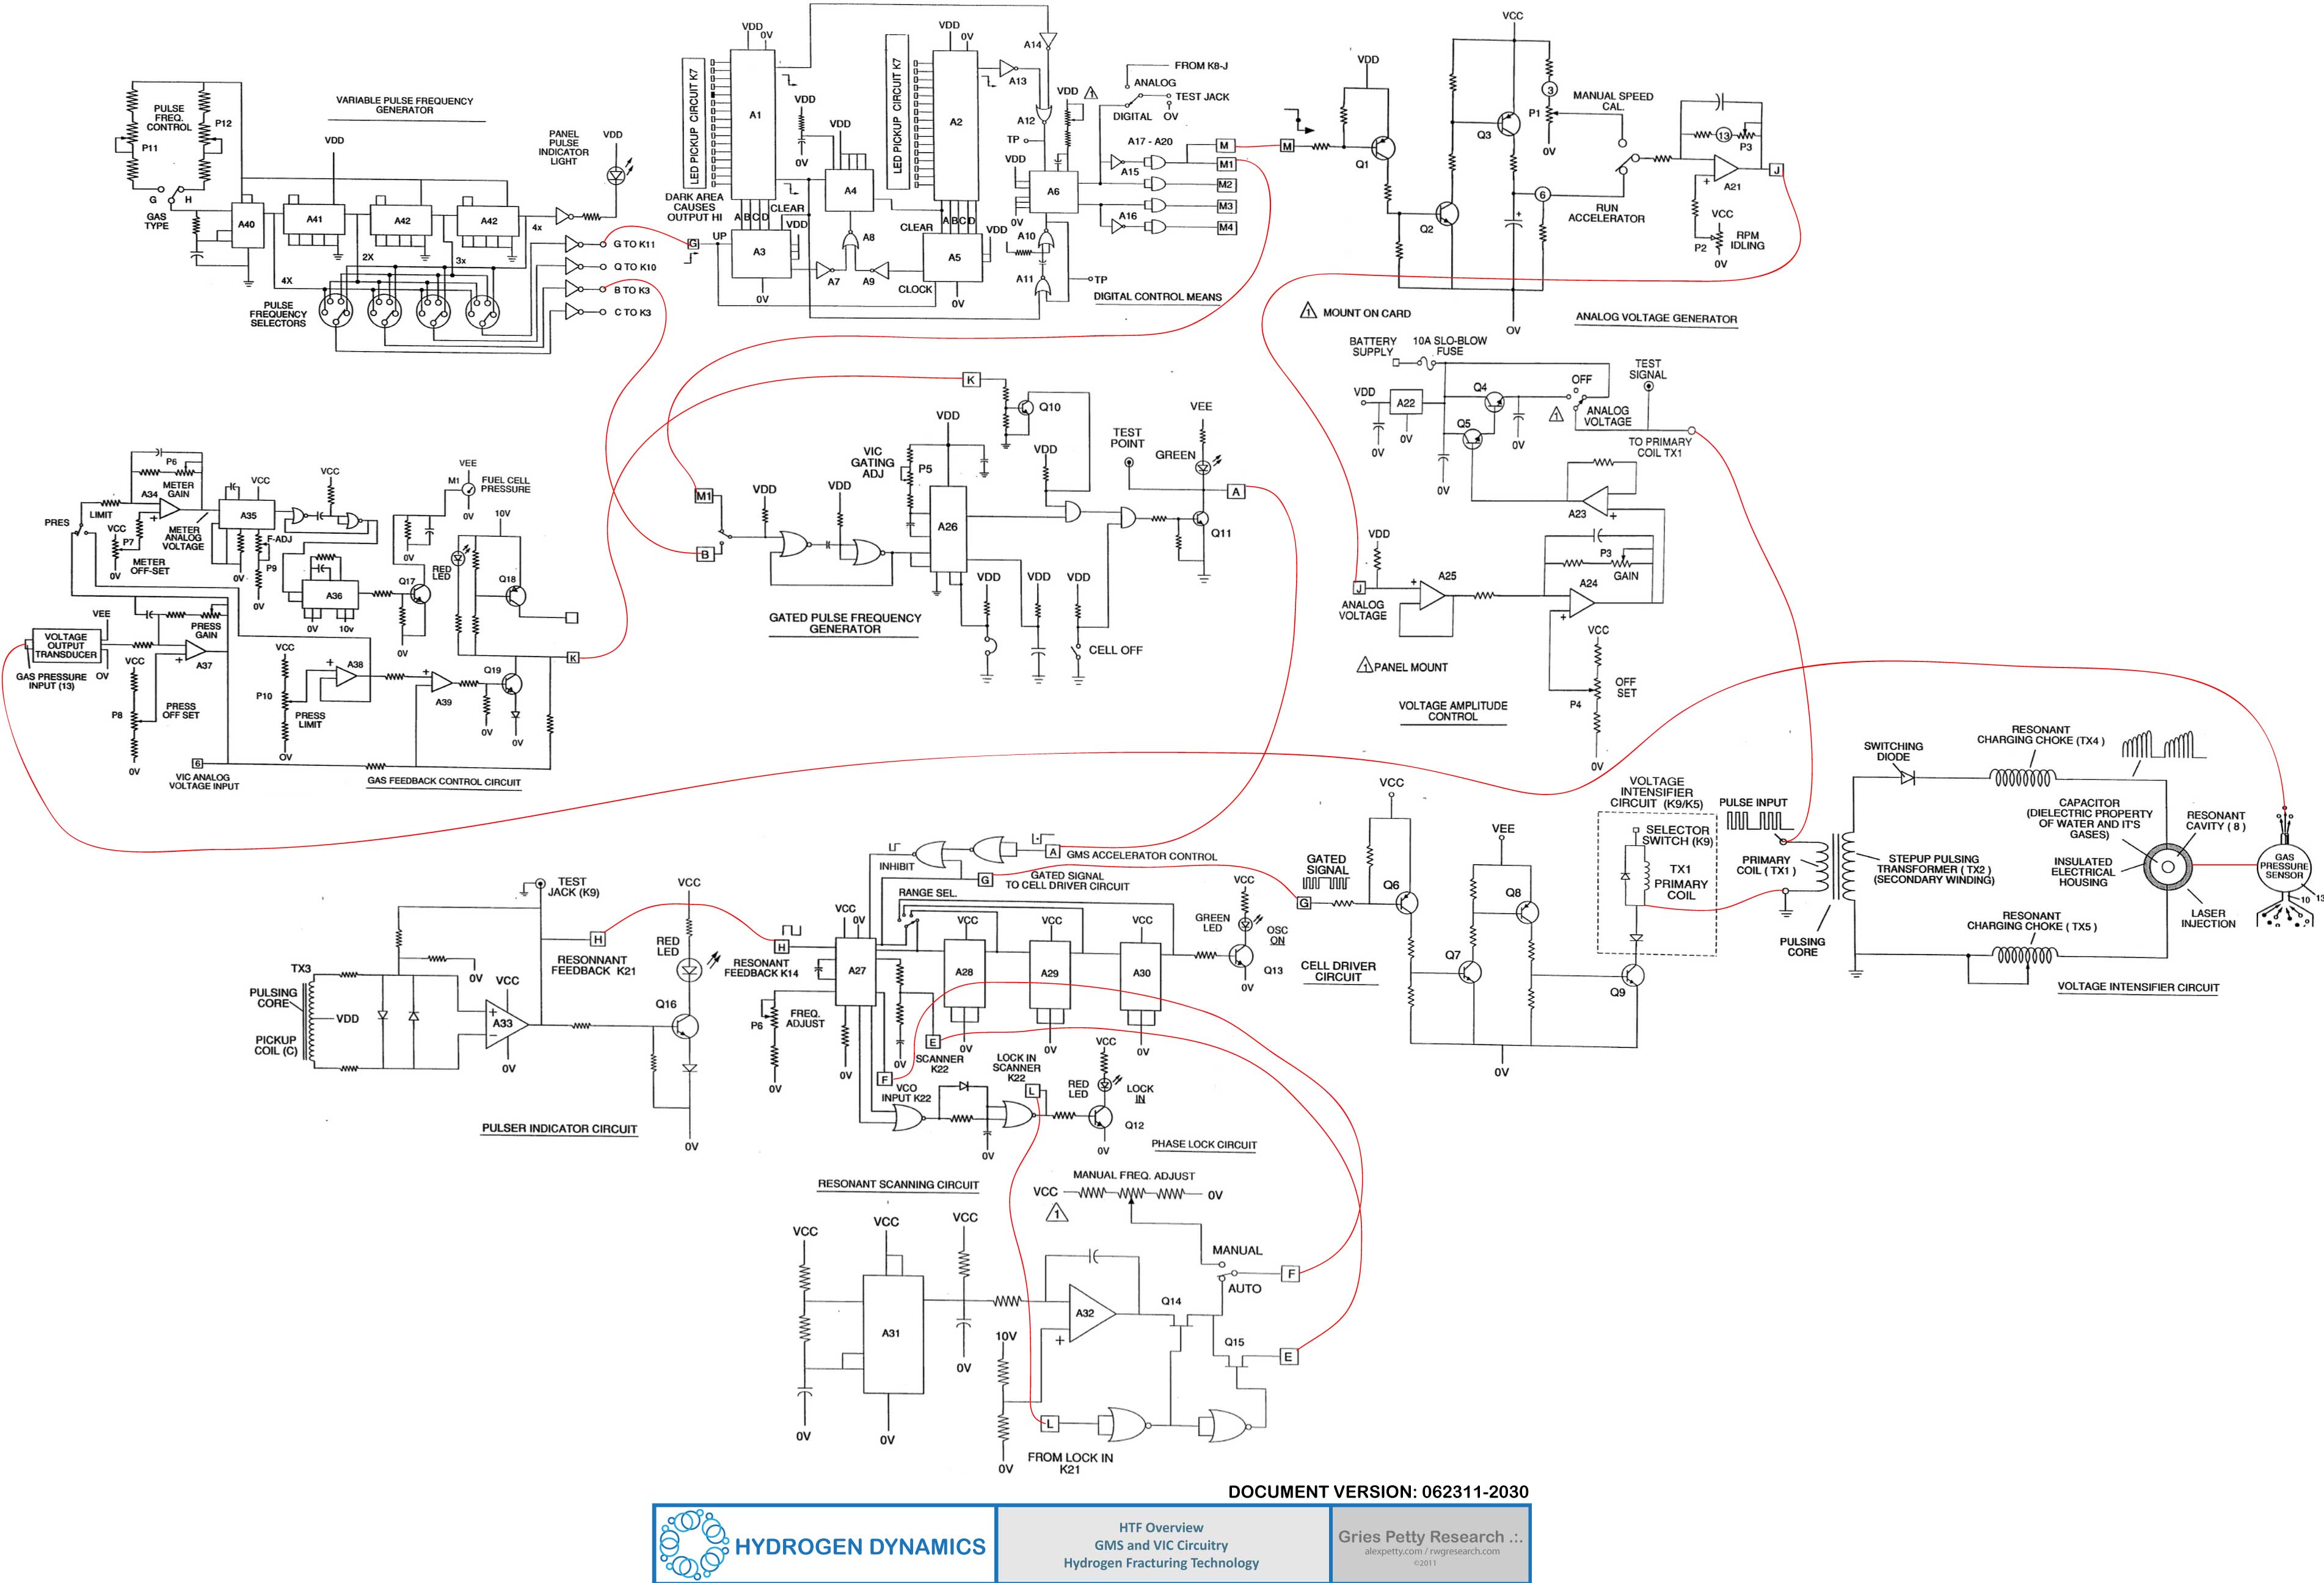
You may need to use your browser’s zoom-out function in order to view the entire diagram. Alternatively, clicking the image will open it at full resolution for easier inspection.