Puharich Stage A
In his 1983 patent, Andrija Puharich describes a multi-stage method for splitting water.
The process is not a single electrolysis step.
It is a sequence of electrical and physical conditions applied to the water cell.
The stages of the process are summarized below.
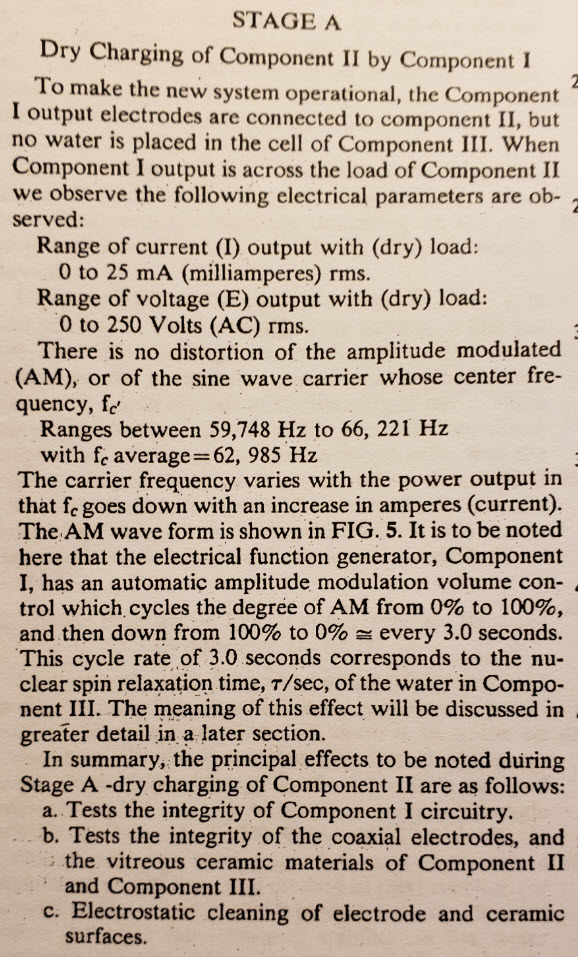
Stage A
Dry charging the cell.
This tests the integrity of the electrical components and electrostatically cleans the electrode surfaces.
Stage B
Stage B contains five phases.
B1
Water is added to the cell but not enough to close the circuit.
B2
Water is added drop by drop until the liquid bridges the exposed electrode surfaces and the circuit closes.
B3
Several electrical changes occur.
The resonant frequency of the system drops.
Voltage and current both decrease.
The waveform changes from the sine wave seen in Stage A to a rippled square wave.
Puharich attributed this change to a shift in the RC constant of the water during treatment.
He also proposed that the waveform frequency becomes entrained with the nuclear spin relaxation constant of water.
τ = 3.0 seconds
At this stage the waveform begins to show higher order harmonics associated with resonances within the water molecule.
B4
As polarization increases the waveform exhibits half wave rectification.
A faint vapor appears which indicates slight electrolysis.
Another effect occurs at this stage. A reverse threshold is reached.
If the circuit is opened and water is removed until the level falls below the cathode insulation line:
Voltage falls to zero.
Current falls to zero.
The rippled square wave disappears.
Instead positive unipolar pulses appear within the water.
B5
Puharich proposed that during this process the water shifts into a more rigid structural configuration.
He described the result as a tetrahedral conformation where the bond angle changes from
104° to 109° 28′
According to the patent resonance can only be applied efficiently after this structural change occurs.
Stage C
A new waveform is applied that matches the behavior observed during Stage B.
The rippled square wave transitions into a rippled sawtooth waveform.
Four higher order harmonics appear:
Carrier frequency
3980 Hz
OHM1
7960 Hz
OHM2
15,920 Hz
OHM3
31,840 Hz
OHM4
63,690 Hz
Puharich suggested these harmonics correspond to resonance modes associated with the geometry of the water molecule.
Gas produced at this stage reportedly forms a centripetal pearl chain pattern that resembles spokes of a wheel inside the cell.
Stage D
Rapid hydrolysis slows after roughly 27 minutes of operation as a barrier potential forms.
Stage E
Operation becomes inhibited as microscopic gas bubbles accumulate on the electrode surfaces.
Stage F
Mechanical vibration can dislodge these bubbles.
Tapping the cell can restore operation.
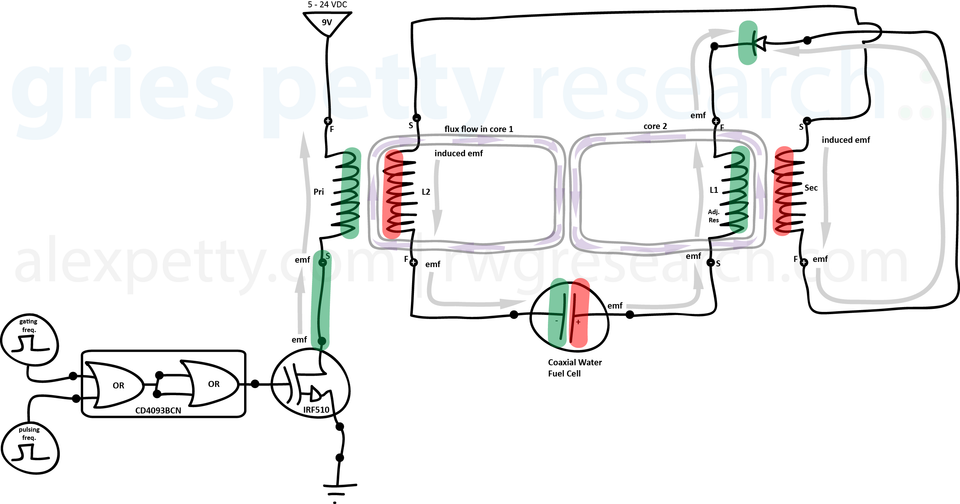
Demonstration of Stage A
The apparatus used to explore Stage A is shown below.
Puharich described the system with the following block diagram.
Replication Setup
The configuration used in my testing is shown below.
Waveform Generation
The waveform input is produced using a circuit built for this purpose.
The circuit generates:
Carrier wave frequency
Audio modulation frequency
Amplitude modulation
Amplitude ramp-up and ramp-down
All parameters follow the specifications described in the patent.
Mixer / Pre-Amplifier
The mixer used is a Mackie 1402 VLZ.
Each of the first six channels includes a built in pre amplifier.
At this stage the signal is amplified from
2 Vpp to 5 Vpp
Frequency response:
+0, −1 dB : 20 Hz to 50 kHz
+0, −3 dB : below 10 Hz up to 100 kHz
Power Amplifier
The power amplifier used is a QSC RMX 2450 capable of 1300 W bridged mono output.
Here the signal is amplified from
5 Vpp to 250 Vpp
Frequency response:
20 Hz to 20 kHz : +0 / −1 dB
−3 dB at 5 Hz and 50 kHz
−5 dB at 100 kHz
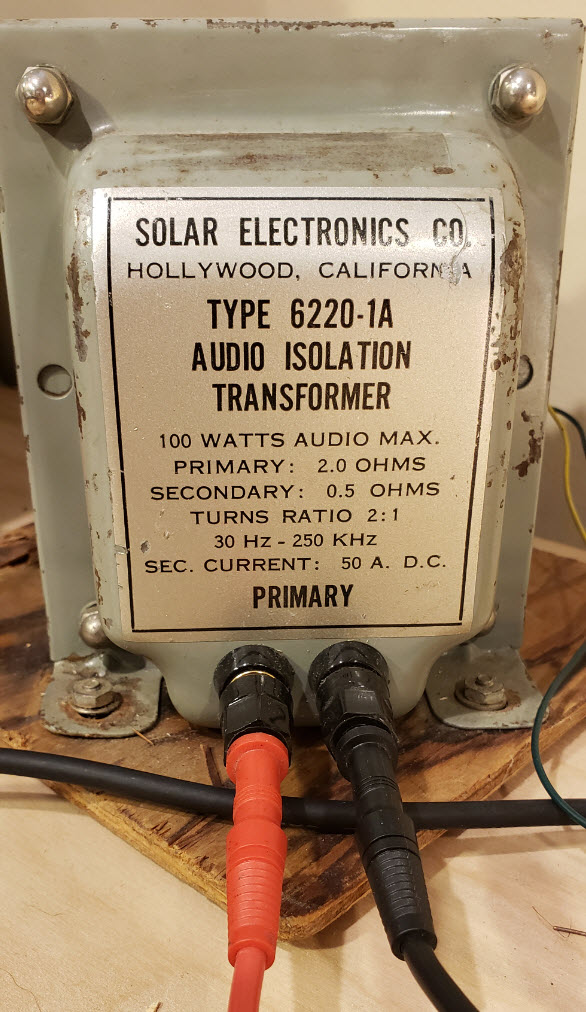
Isolation Transformer
The Water Capacitor
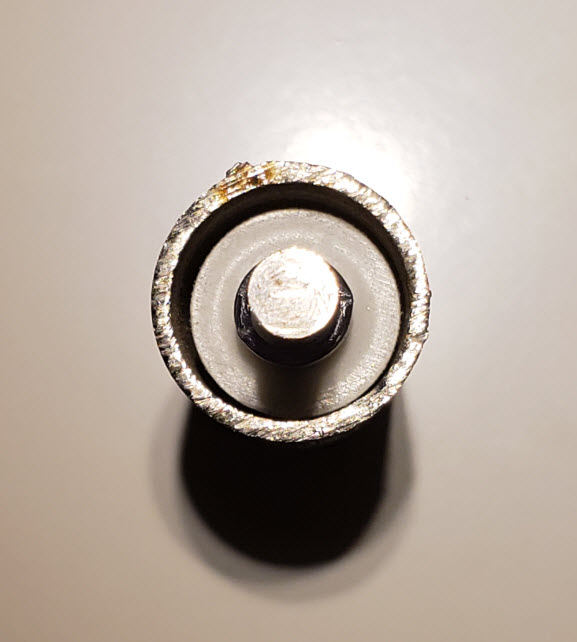
Puharich’s water capacitor is shown below.
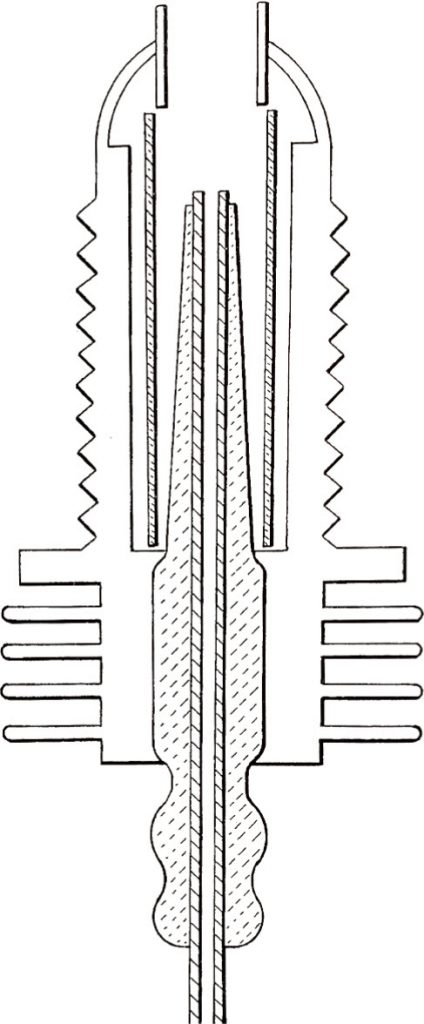
On close inspection the device strongly resembles a modified spark plug. The construction includes the same basic elements found in an ignition plug:
A threaded metal body that forms the outer electrode.
A central conductor isolated by a ceramic insulator.
A curved dome at the tip that creates the discharge region.
In an automobile engine this structure produces an electrical spark across a small air gap. In Puharich’s apparatus the same geometry is used inside a water-filled chamber.
The ceramic insulator isolates the central electrode while allowing the electric field to concentrate at the exposed tip. The threaded metal shell provides the opposing electrode surface.
Several features from the original design were simplified for testing:
Heat dissipation fins
Glass gas routing tubes
The asymmetric conical insulator
In the original device the conical insulator gradually exposes the water to the cathode potential as the cell fills. This produces a progressive polarization effect during filling.
The glass tubes allow controlled collection and routing of the produced gases for measurement.
Simplified Test Cell
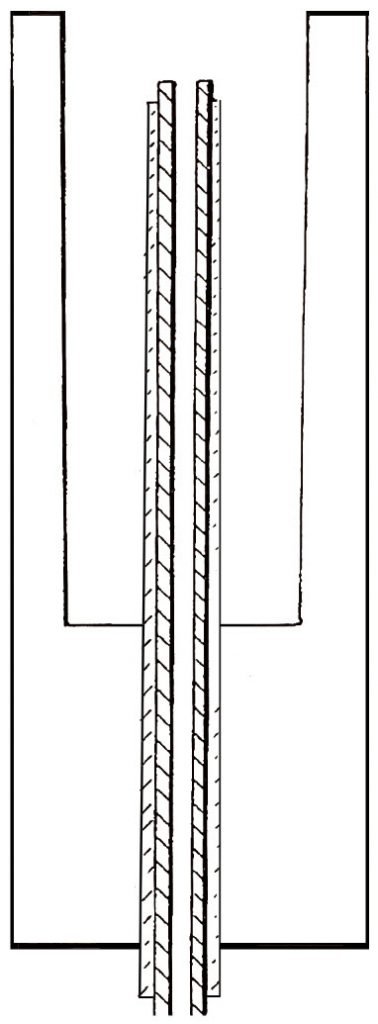
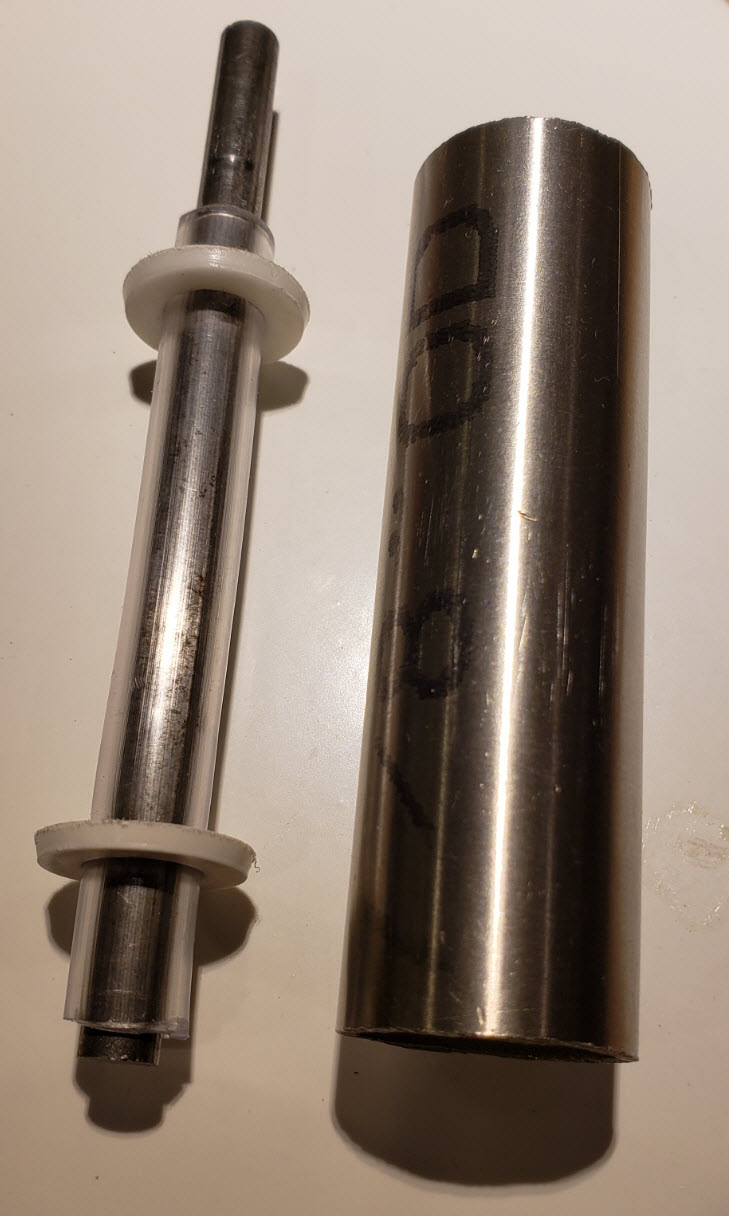
Physical Construction
Disassembled view:
Top view:
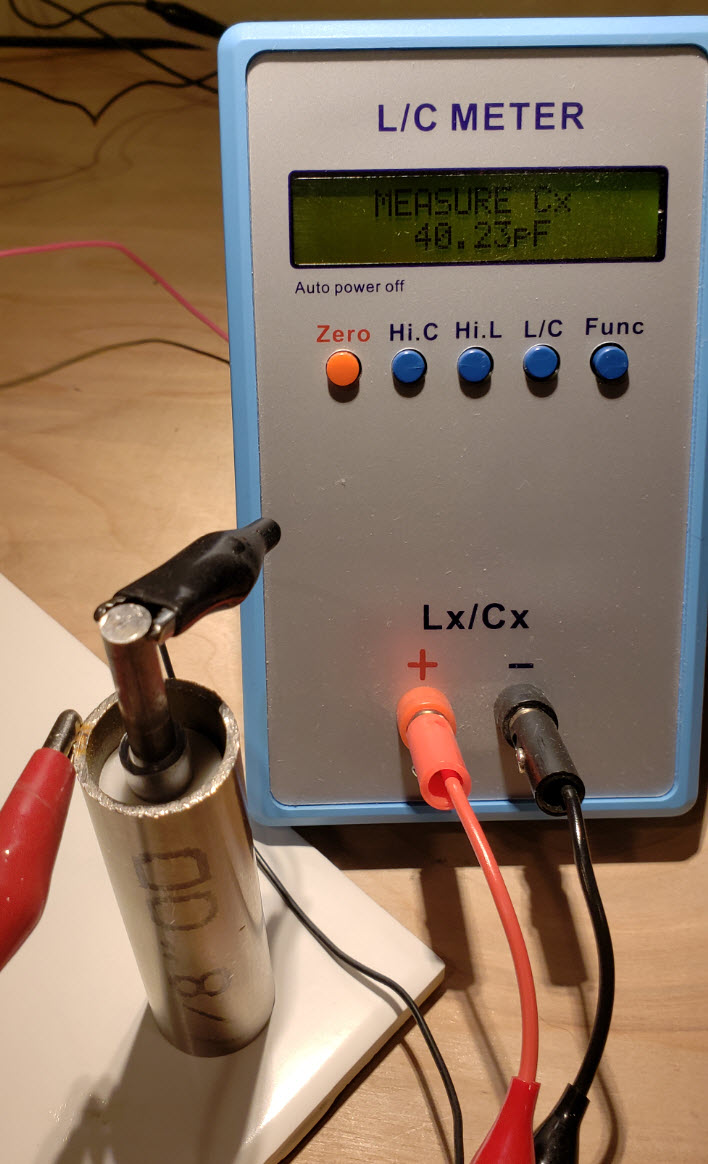
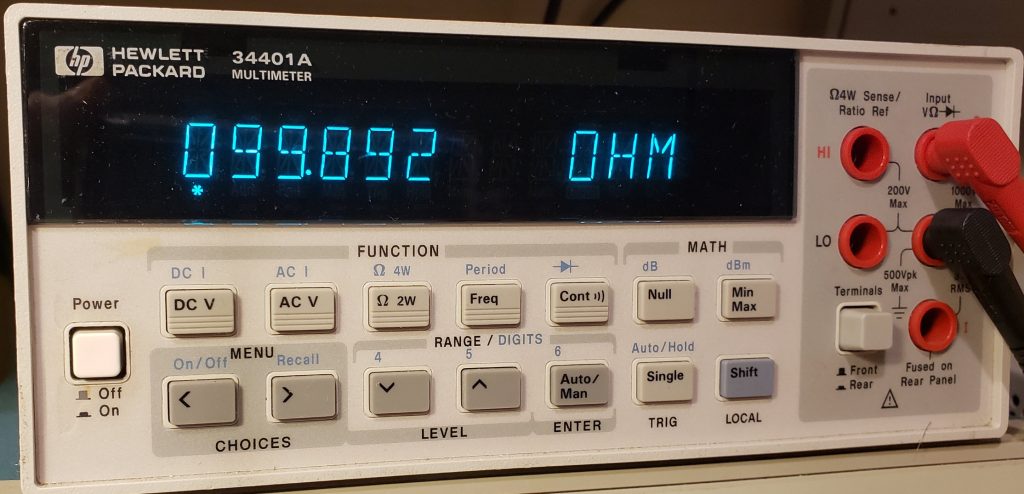
Capacitance
Measured capacitance of the cell:
C ≈ 40.23 pF
Inductors
Two inductors are placed on either side of the cell.
These were built by Russ Gries.
L1
Inductance: 565.2 mH
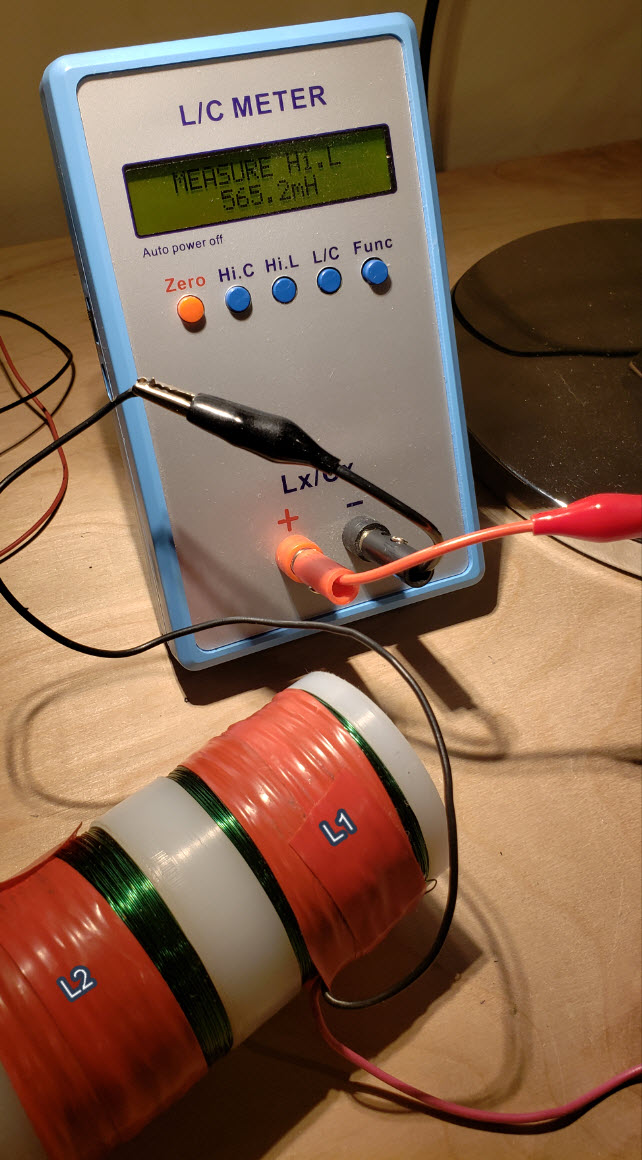
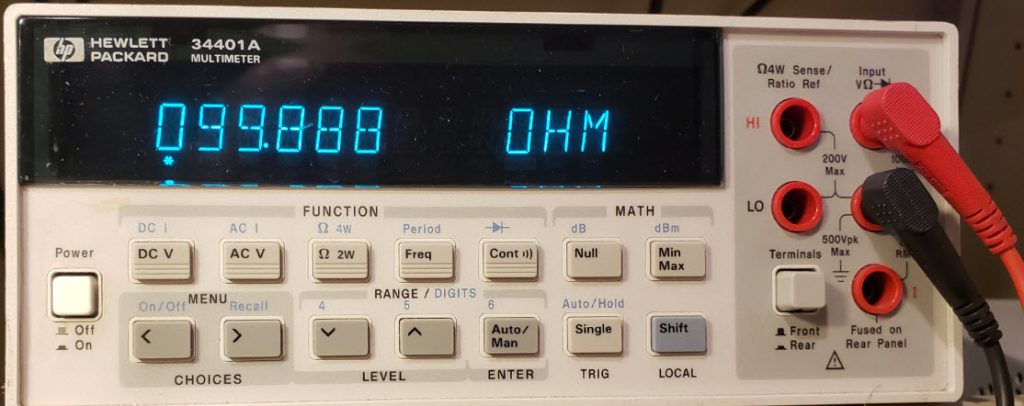
DC resistance approximately 100 Ω
L2
Inductance: 565.2 mH
DC resistance approximately 100 Ω
Resonant Frequency
The resonant frequency can be approximated by
f_r = 1 / (2π√LC)
Using
L = 0.5652 H
C = 4.02 × 10⁻¹¹ F
This yields
f_r ≈ 33.38 kHz
Stage A Operation
According to Puharich Stage A involves dry charging the cell.
Experimental Results
Measured resonance during testing:
approximately 29 kHz
At resonance:
Voltage approximately 240 Vpp
Current approximately 870 mA
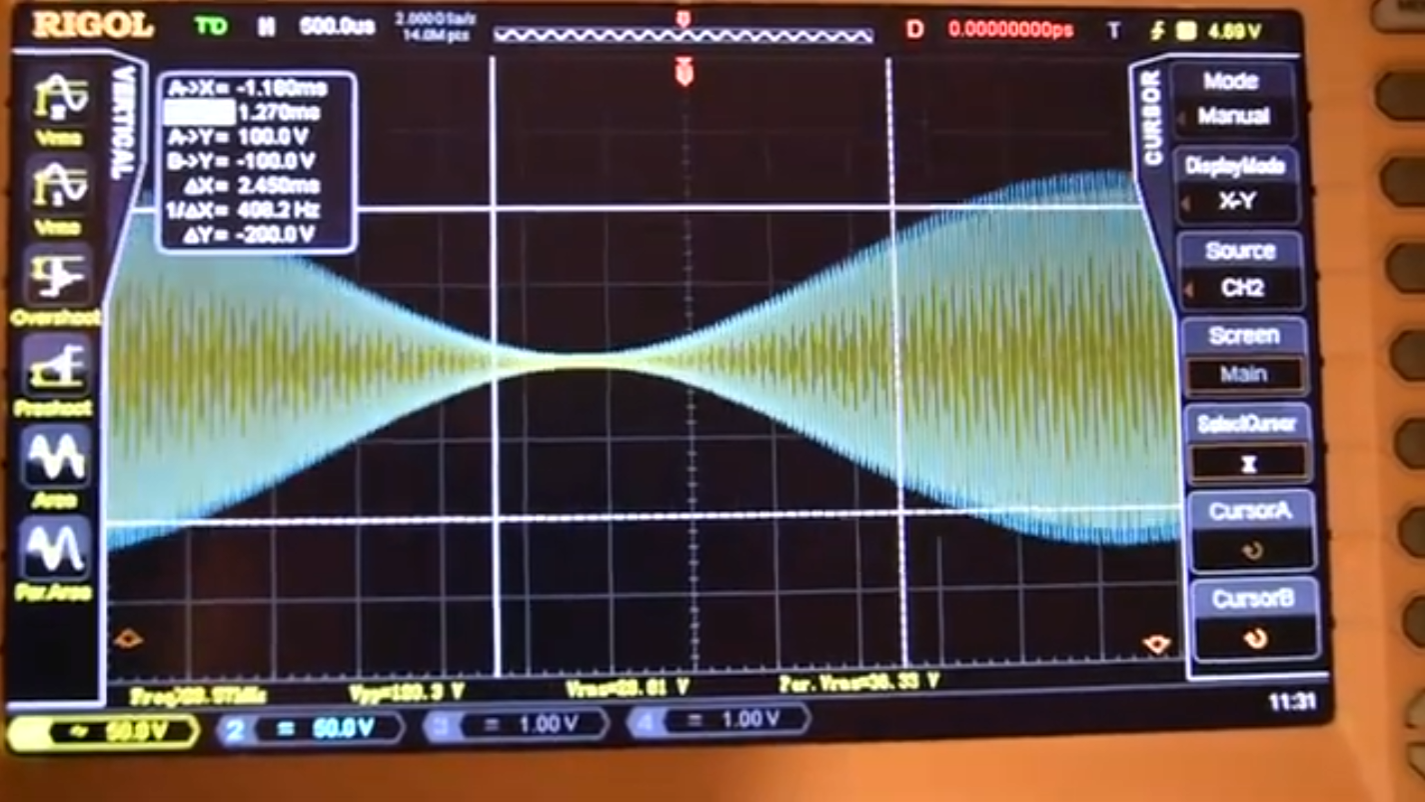
Video demonstration:
In the video:
The analog scope shows the 5 V signal from the pre amplifier.
The digital scope shows the amplified signal across the cell.
Yellow trace is on the cathode.
Blue trace is on the anode.
The traces appear nearly superimposed.
Next Steps
The next stage of testing will attempt to:
Reduce Stage A current toward 25 mA
Increase Stage A voltage toward 250 Vrms
Increase carrier frequency toward 62 kHz
These adjustments can be achieved by:
Increasing spacing between capacitor plates
Adjusting the inductance values of L1 and L2
Demonstrations of Stages B through F will follow.
.:.