Avoidance
The Spectral Repulsion
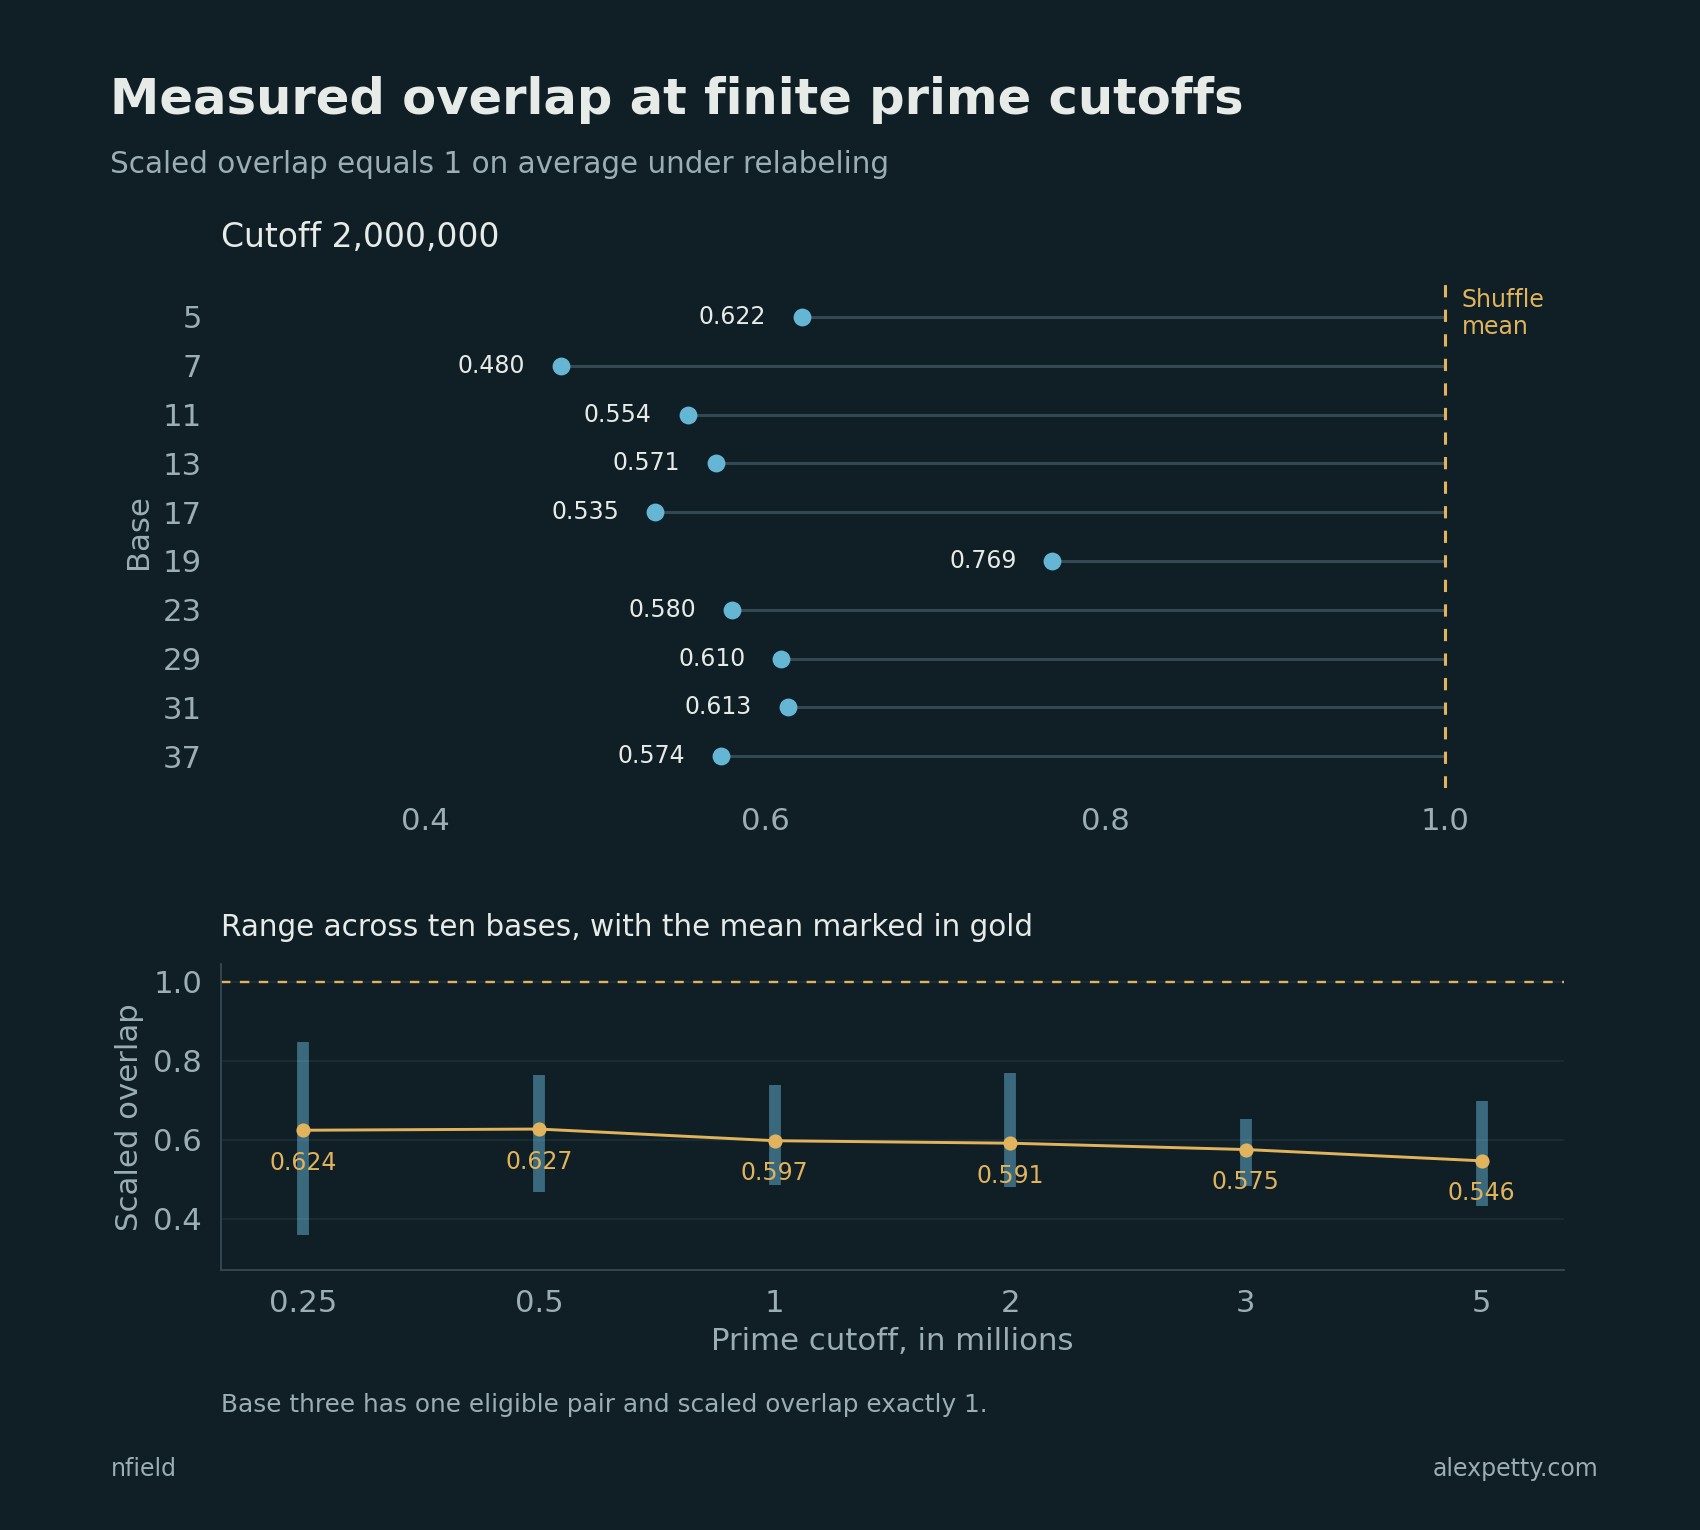
At base five the collision table and the primes spread their weight over the same four pairs of characters, and they very nearly avoid each other. One pair carries about percent of the prime weight and less than half a percent of the collision weight. The two pairs that hold percent of the collision weight hold only percent of the prime weight. Deal the prime weights out to the four pairs at random and the overlap averages a known amount, exactly one on the scale used below. The real assignment comes in at . Across ten bases and six cutoffs, all sixty comparisons that can be made come in below one.
The shortfall matters because of how the collision sum is built. At exponent one half it is a sum over characters, each term a collision coefficient times a prime sum, and in The Double Transversality the larger coefficients kept meeting the smaller prime sums. A correlation of sizes is hard to judge on its own. Turning both lists into shares of a fixed total gives it a yardstick, because the average over every relabeling of the shares can be computed exactly. Spectral repulsion is the name for the measured shortfall below that average. It moves with the cutoff, and whether it lasts is open. The same table also carries a law of a different kind, a sign for every pair of primes whose sum is a multiple of , and that one is proved.
Two rows that each add to one
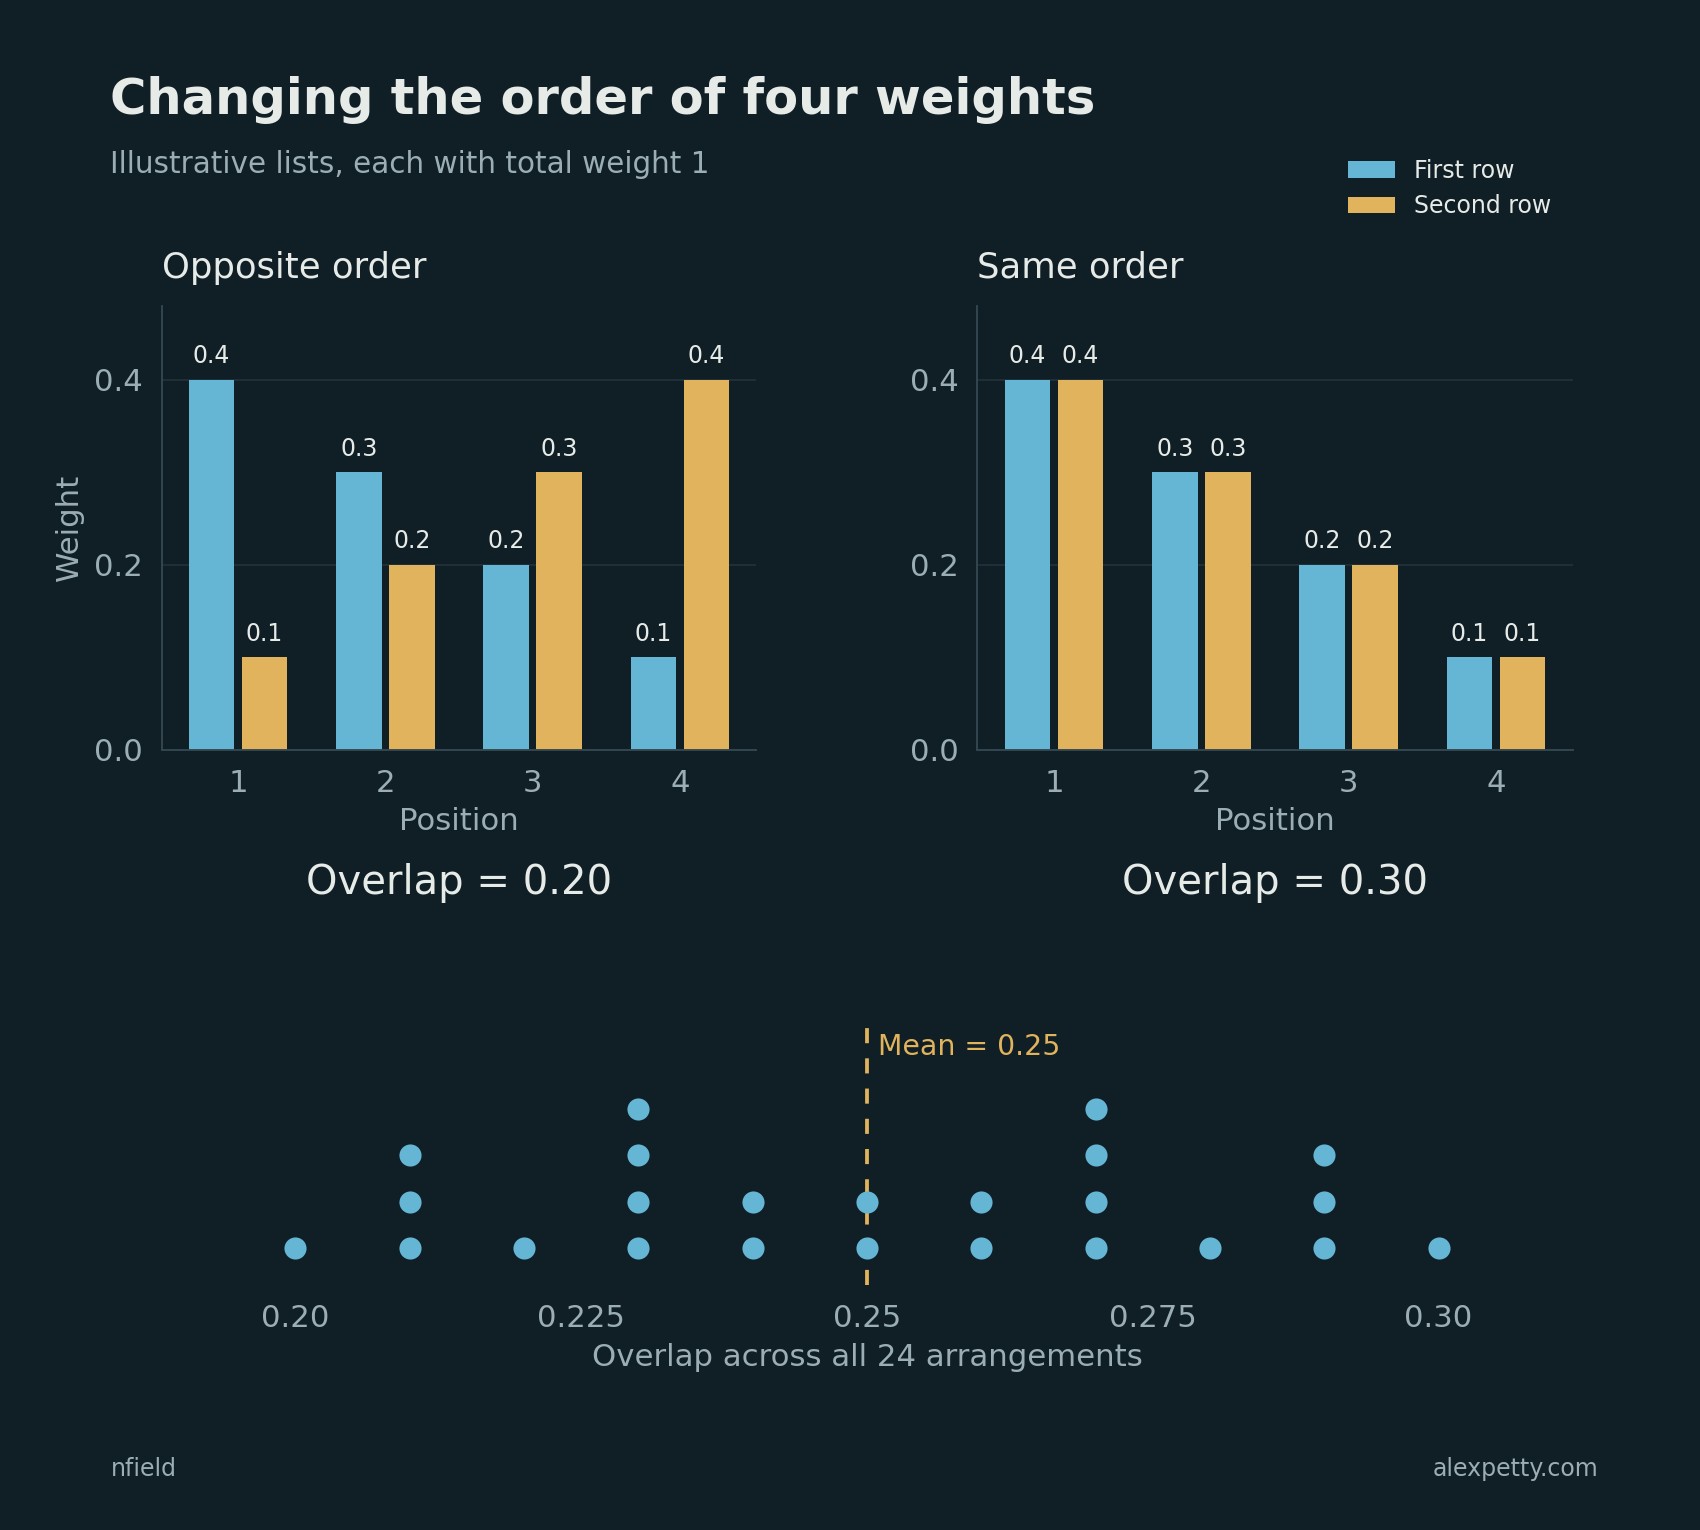
The comparison shows up most clearly on made-up numbers. Take two rows of four weights, each adding to one, the first and the second the same numbers in the opposite order. Multiply the rows position by position and add, and the overlap is .
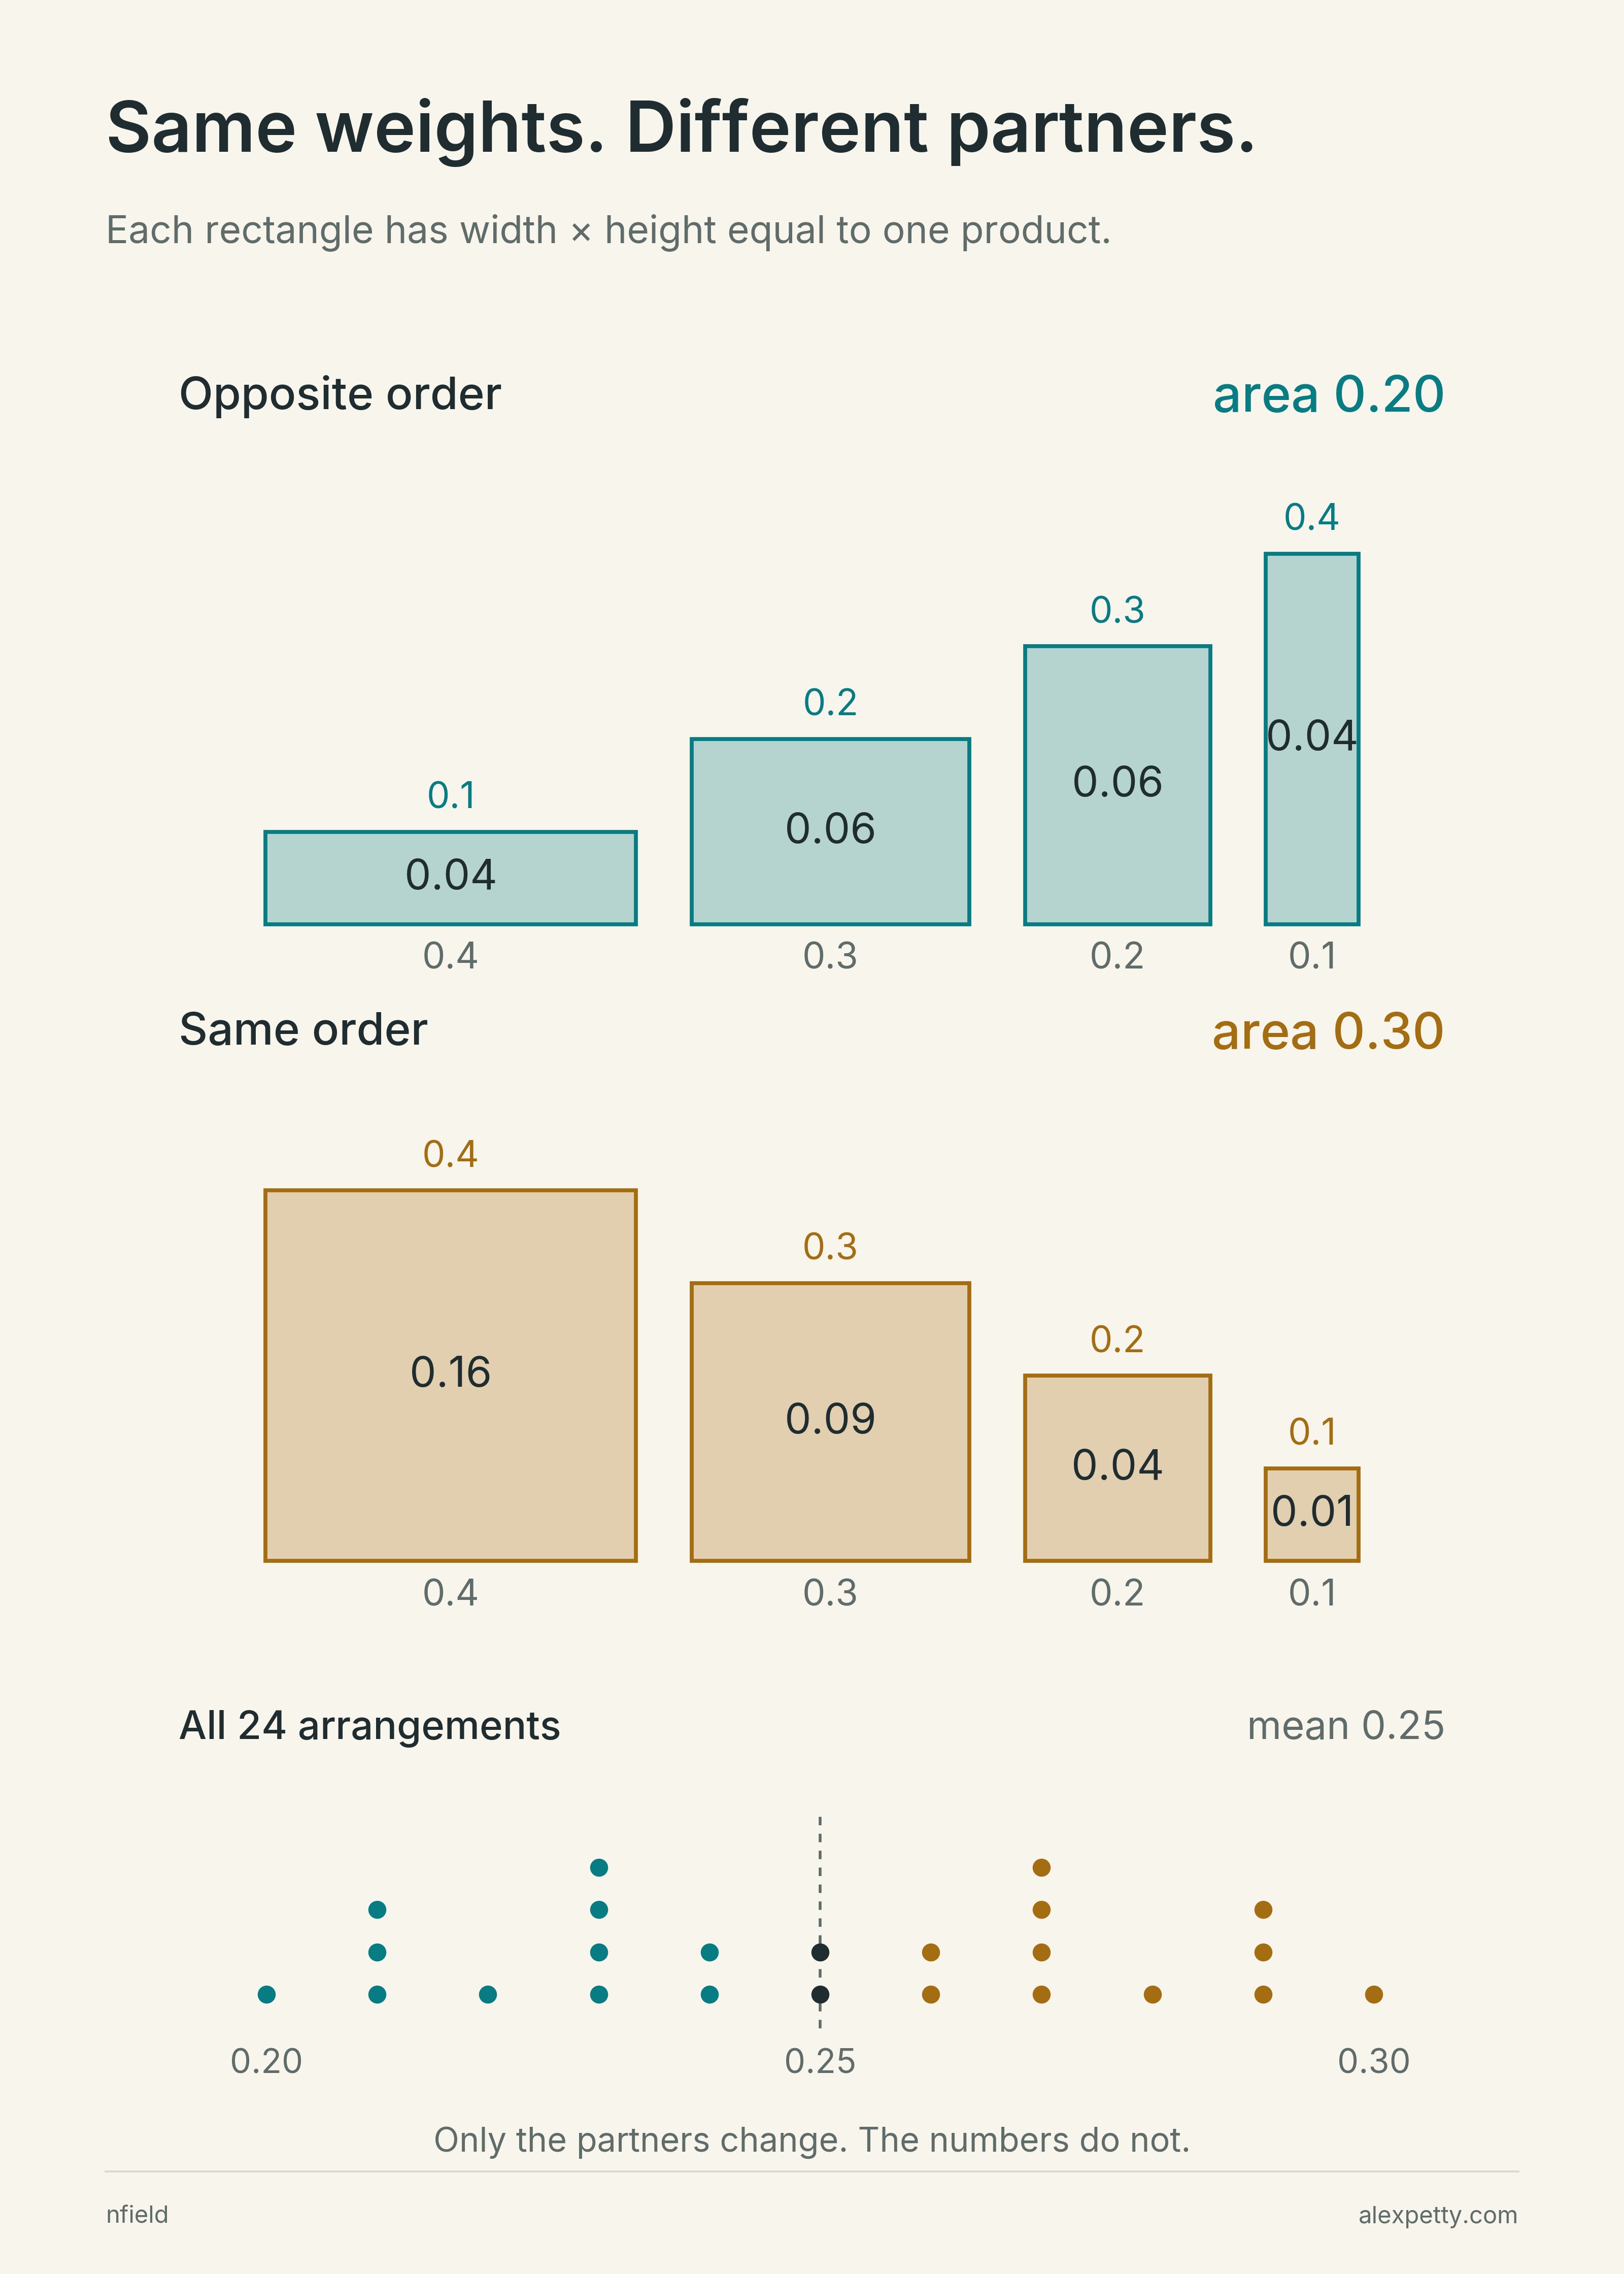
In the figure each product is a rectangle, its width from one row and its height from the other. In opposite order every tall rectangle is a thin one, so the four areas stay small. Reverse the second row and the large weights stand on the large weights. The square alone nearly matches the whole first arrangement, and the overlap rises to . Neither row has changed, only who meets whom.
The dots along the bottom are all twenty-four ways to deal the second row against the first. They spread from to and average exactly , a quarter of the two totals multiplied together. That average is the yardstick. Opposite order lands twenty percent below it and same order twenty percent above.
Four pairs at twenty-five
Now the rows come from arithmetic. Start with the centered collision table of The Centered Collision Sum, a signed weight for each unit remainder modulo . Each Dirichlet character reads the table and returns a coefficient. Square its size and divide by the total over all characters, and those shares form the first row. For the second row, run the same characters over the primes, each prime contributing its character value divided by its square root,
then square and normalize again. Both rows now add to one.
Before anything is shuffled, the table has already ruled most characters out. For an odd prime base, reflection removes the even characters and family centering removes the ones inherited from modulus . What remains are the primitive odd characters, the patterns that flip sign under reflection and need the full modulus , and both rows are normalized on those. Conjugate characters always carry equal weight, so they stay together in pairs. At base five the modulus is twenty-five, and eight eligible characters make four pairs, labelled A through D.
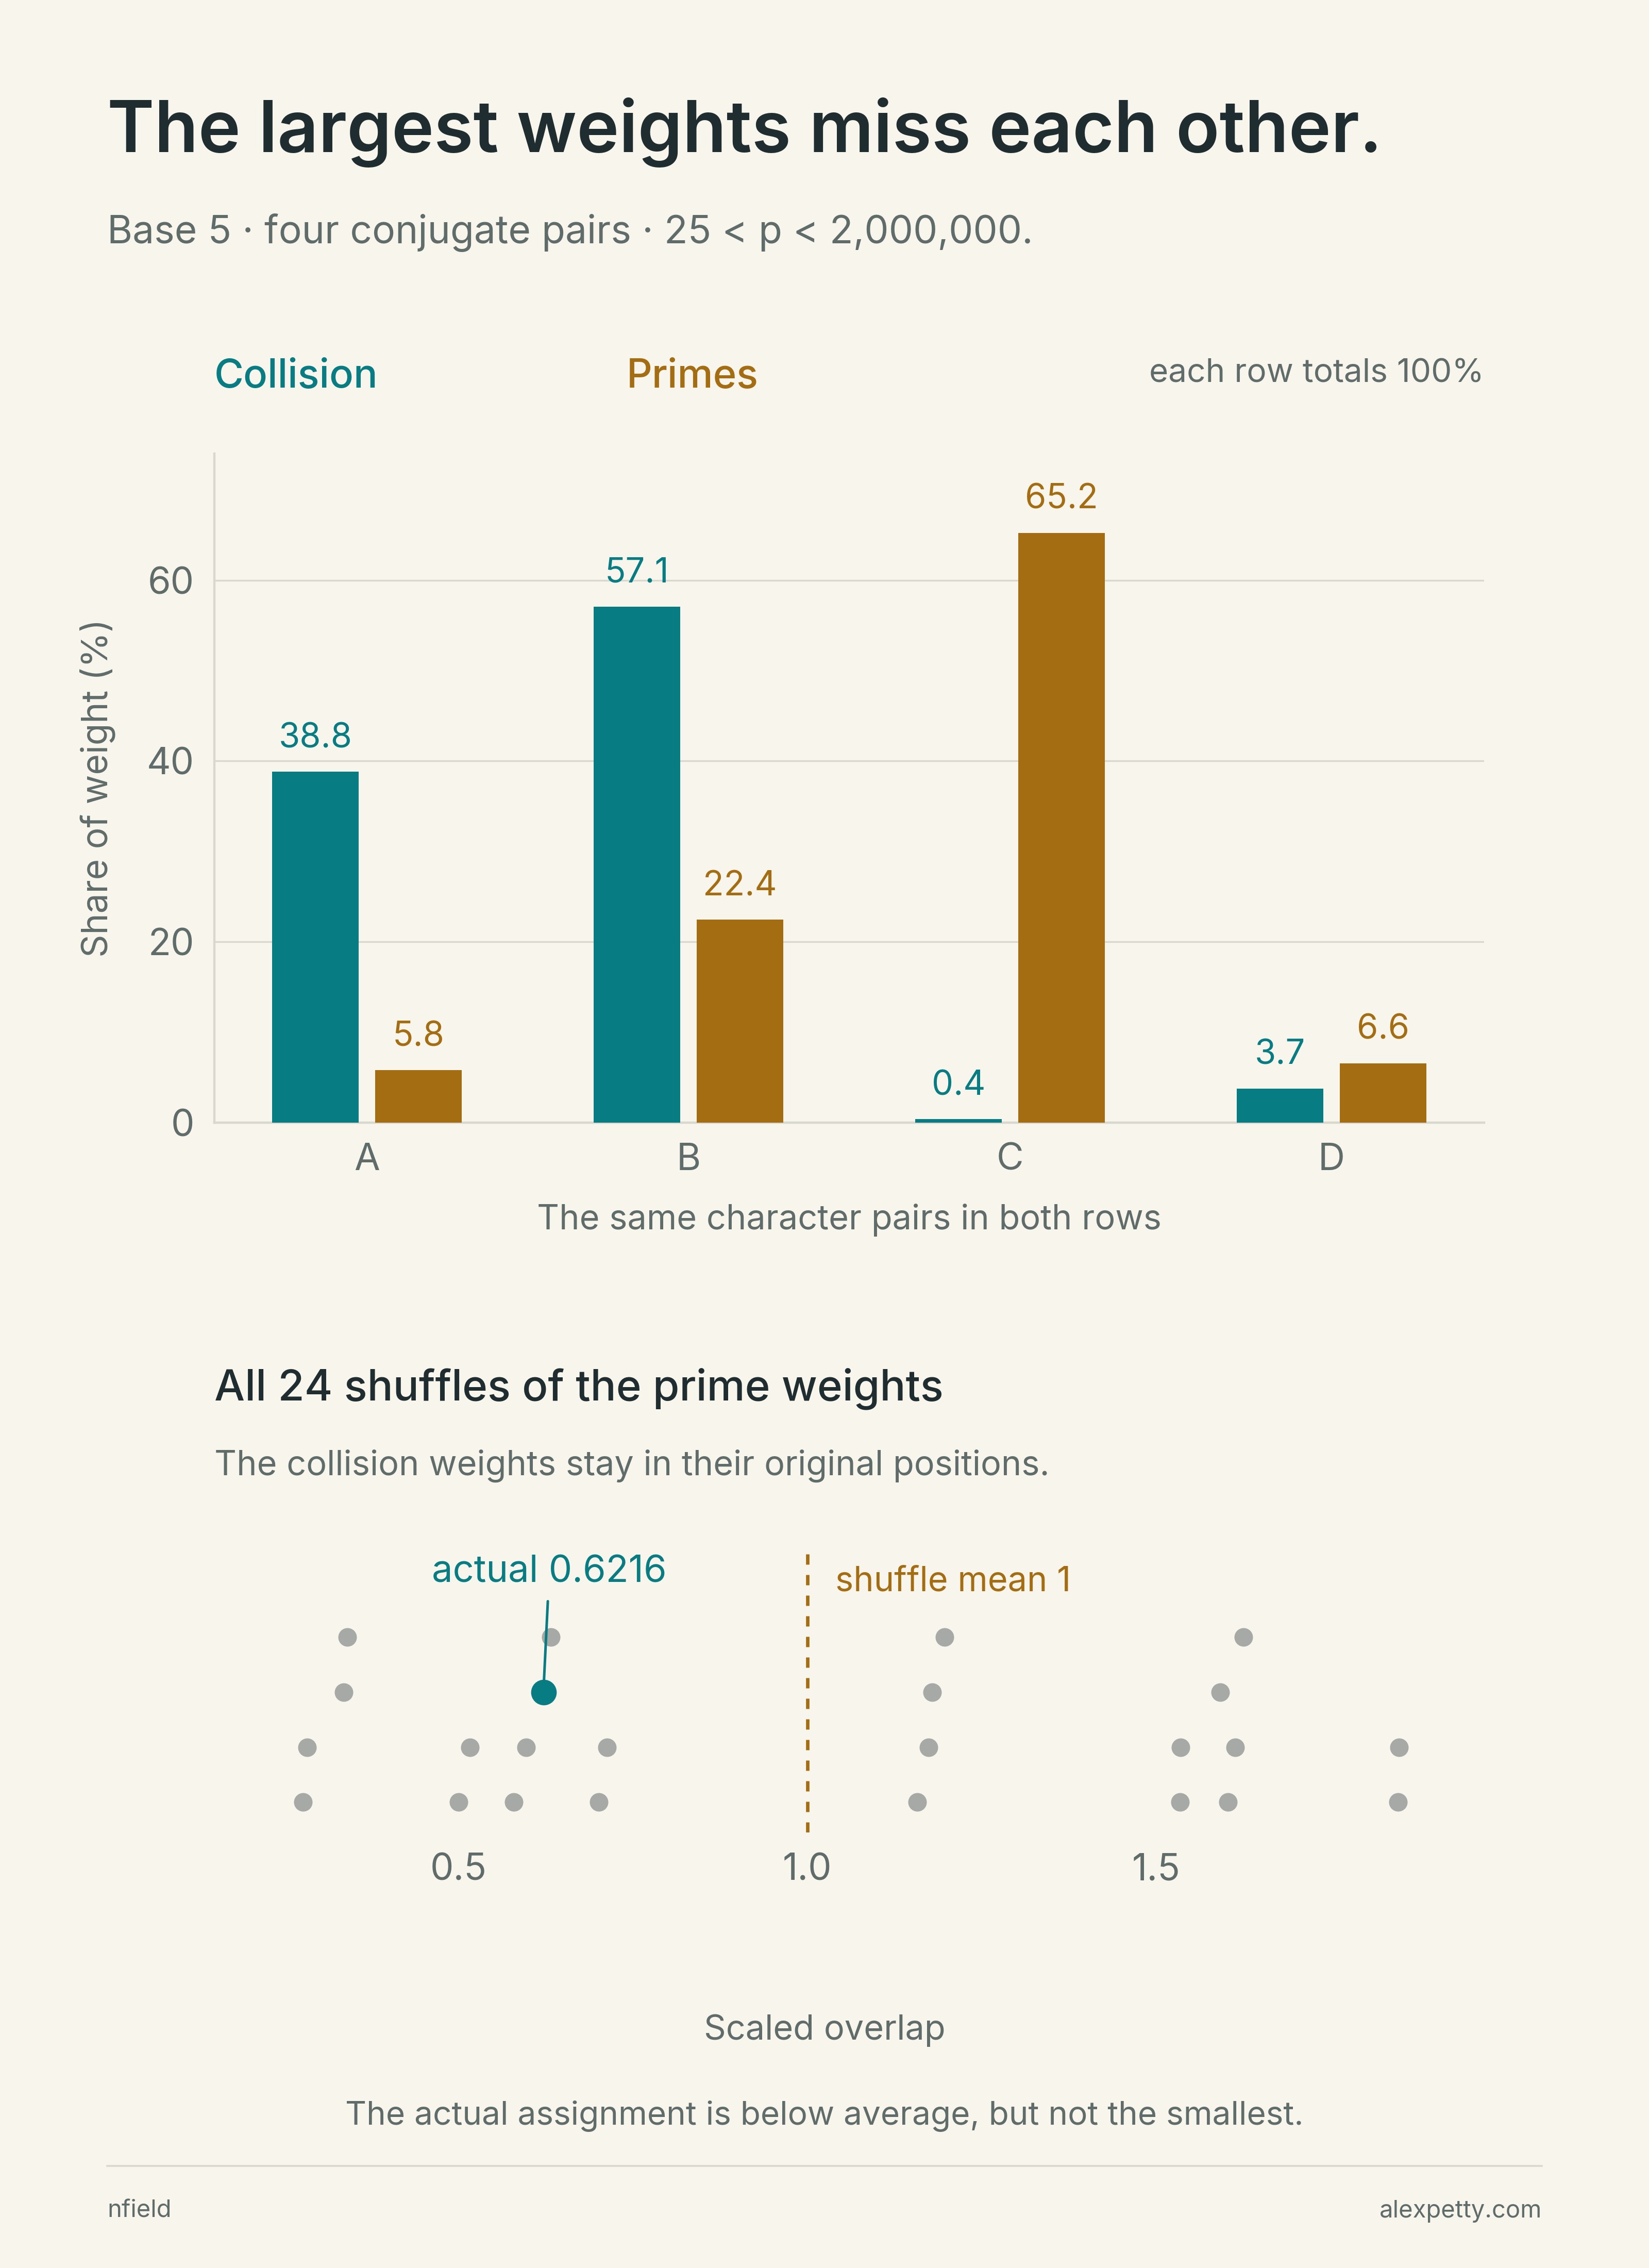
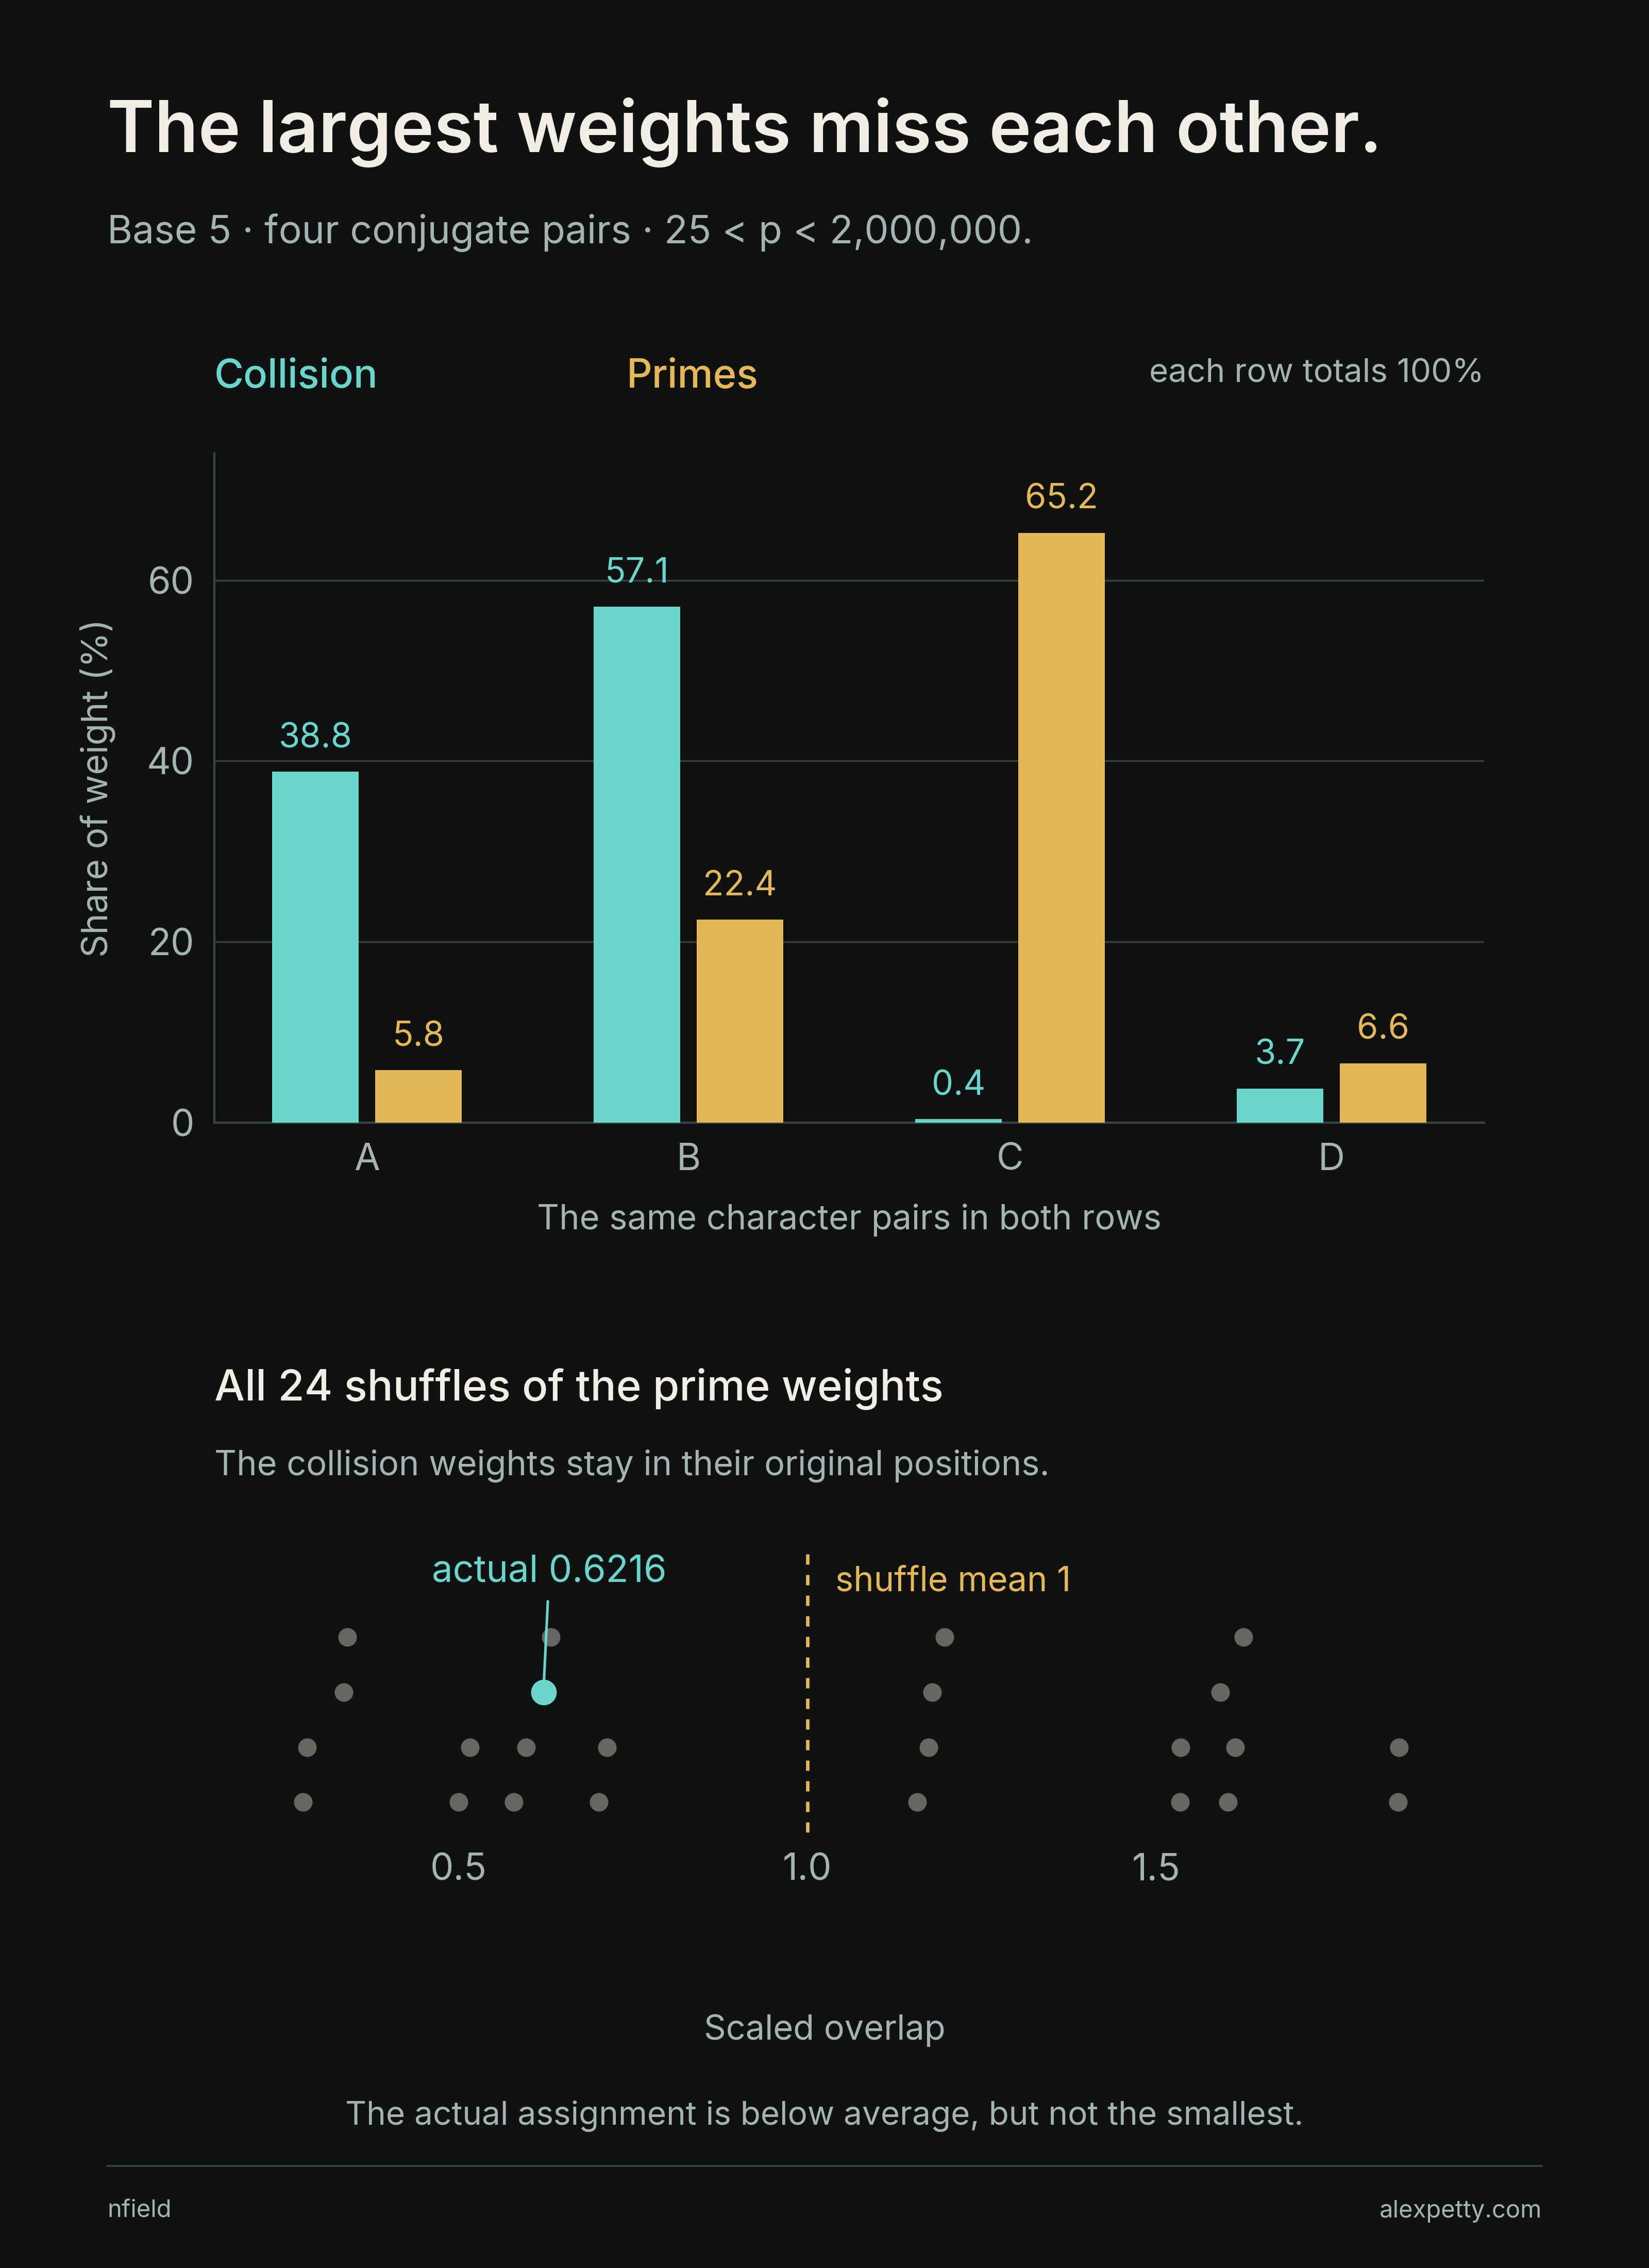
The top half of the figure shows the avoidance plainly. The teal bars stand tall at A and B, and percent of the collision weight. The gold bar at C towers over everything at percent of the prime weight, with a teal sliver of percent beside it. The largest prime weight sits opposite the smallest collision weight.
For pairs with shares and , a uniform shuffle averages , since every prime share visits every position equally often. Scaling by moves the yardstick to one,
At base five . In the lower half of the figure the gray dots are the twenty-four shuffles of the gold bars, and the teal dot is the real assignment, sitting well left of the dashed mean. It isn’t the leftmost, since eight shuffles overlap even less and fifteen overlap more. Nothing in this makes the primes random. The weights stay exactly as computed, and the only randomness anywhere is a permutation of their labels.
The four pairs and their weights
Write , since two generates the unit remainders modulo twenty-five. Pair A joins indices 1 and 19, B joins 3 and 17, C joins 7 and 13, and D joins 9 and 11. The weights below combine the two members of each pair. All primes strictly between and enter the prime sums.
| Pair | Collision share | Prime share |
|---|---|---|
| A | 38.7976% | 5.7905% |
| B | 57.0818% | 22.4346% |
| C | 0.3718% | 65.2180% |
| D | 3.7488% | 6.5569% |
The numbers are rounded for display. The figure and overlap use the unrounded values.
Give the primes more room
Raising the cutoff leaves the collision row untouched and changes the prime row, as new primes enter every character sum. The ledger covers the ten prime bases from five to thirty-seven at six cutoffs, from a quarter million to five million.
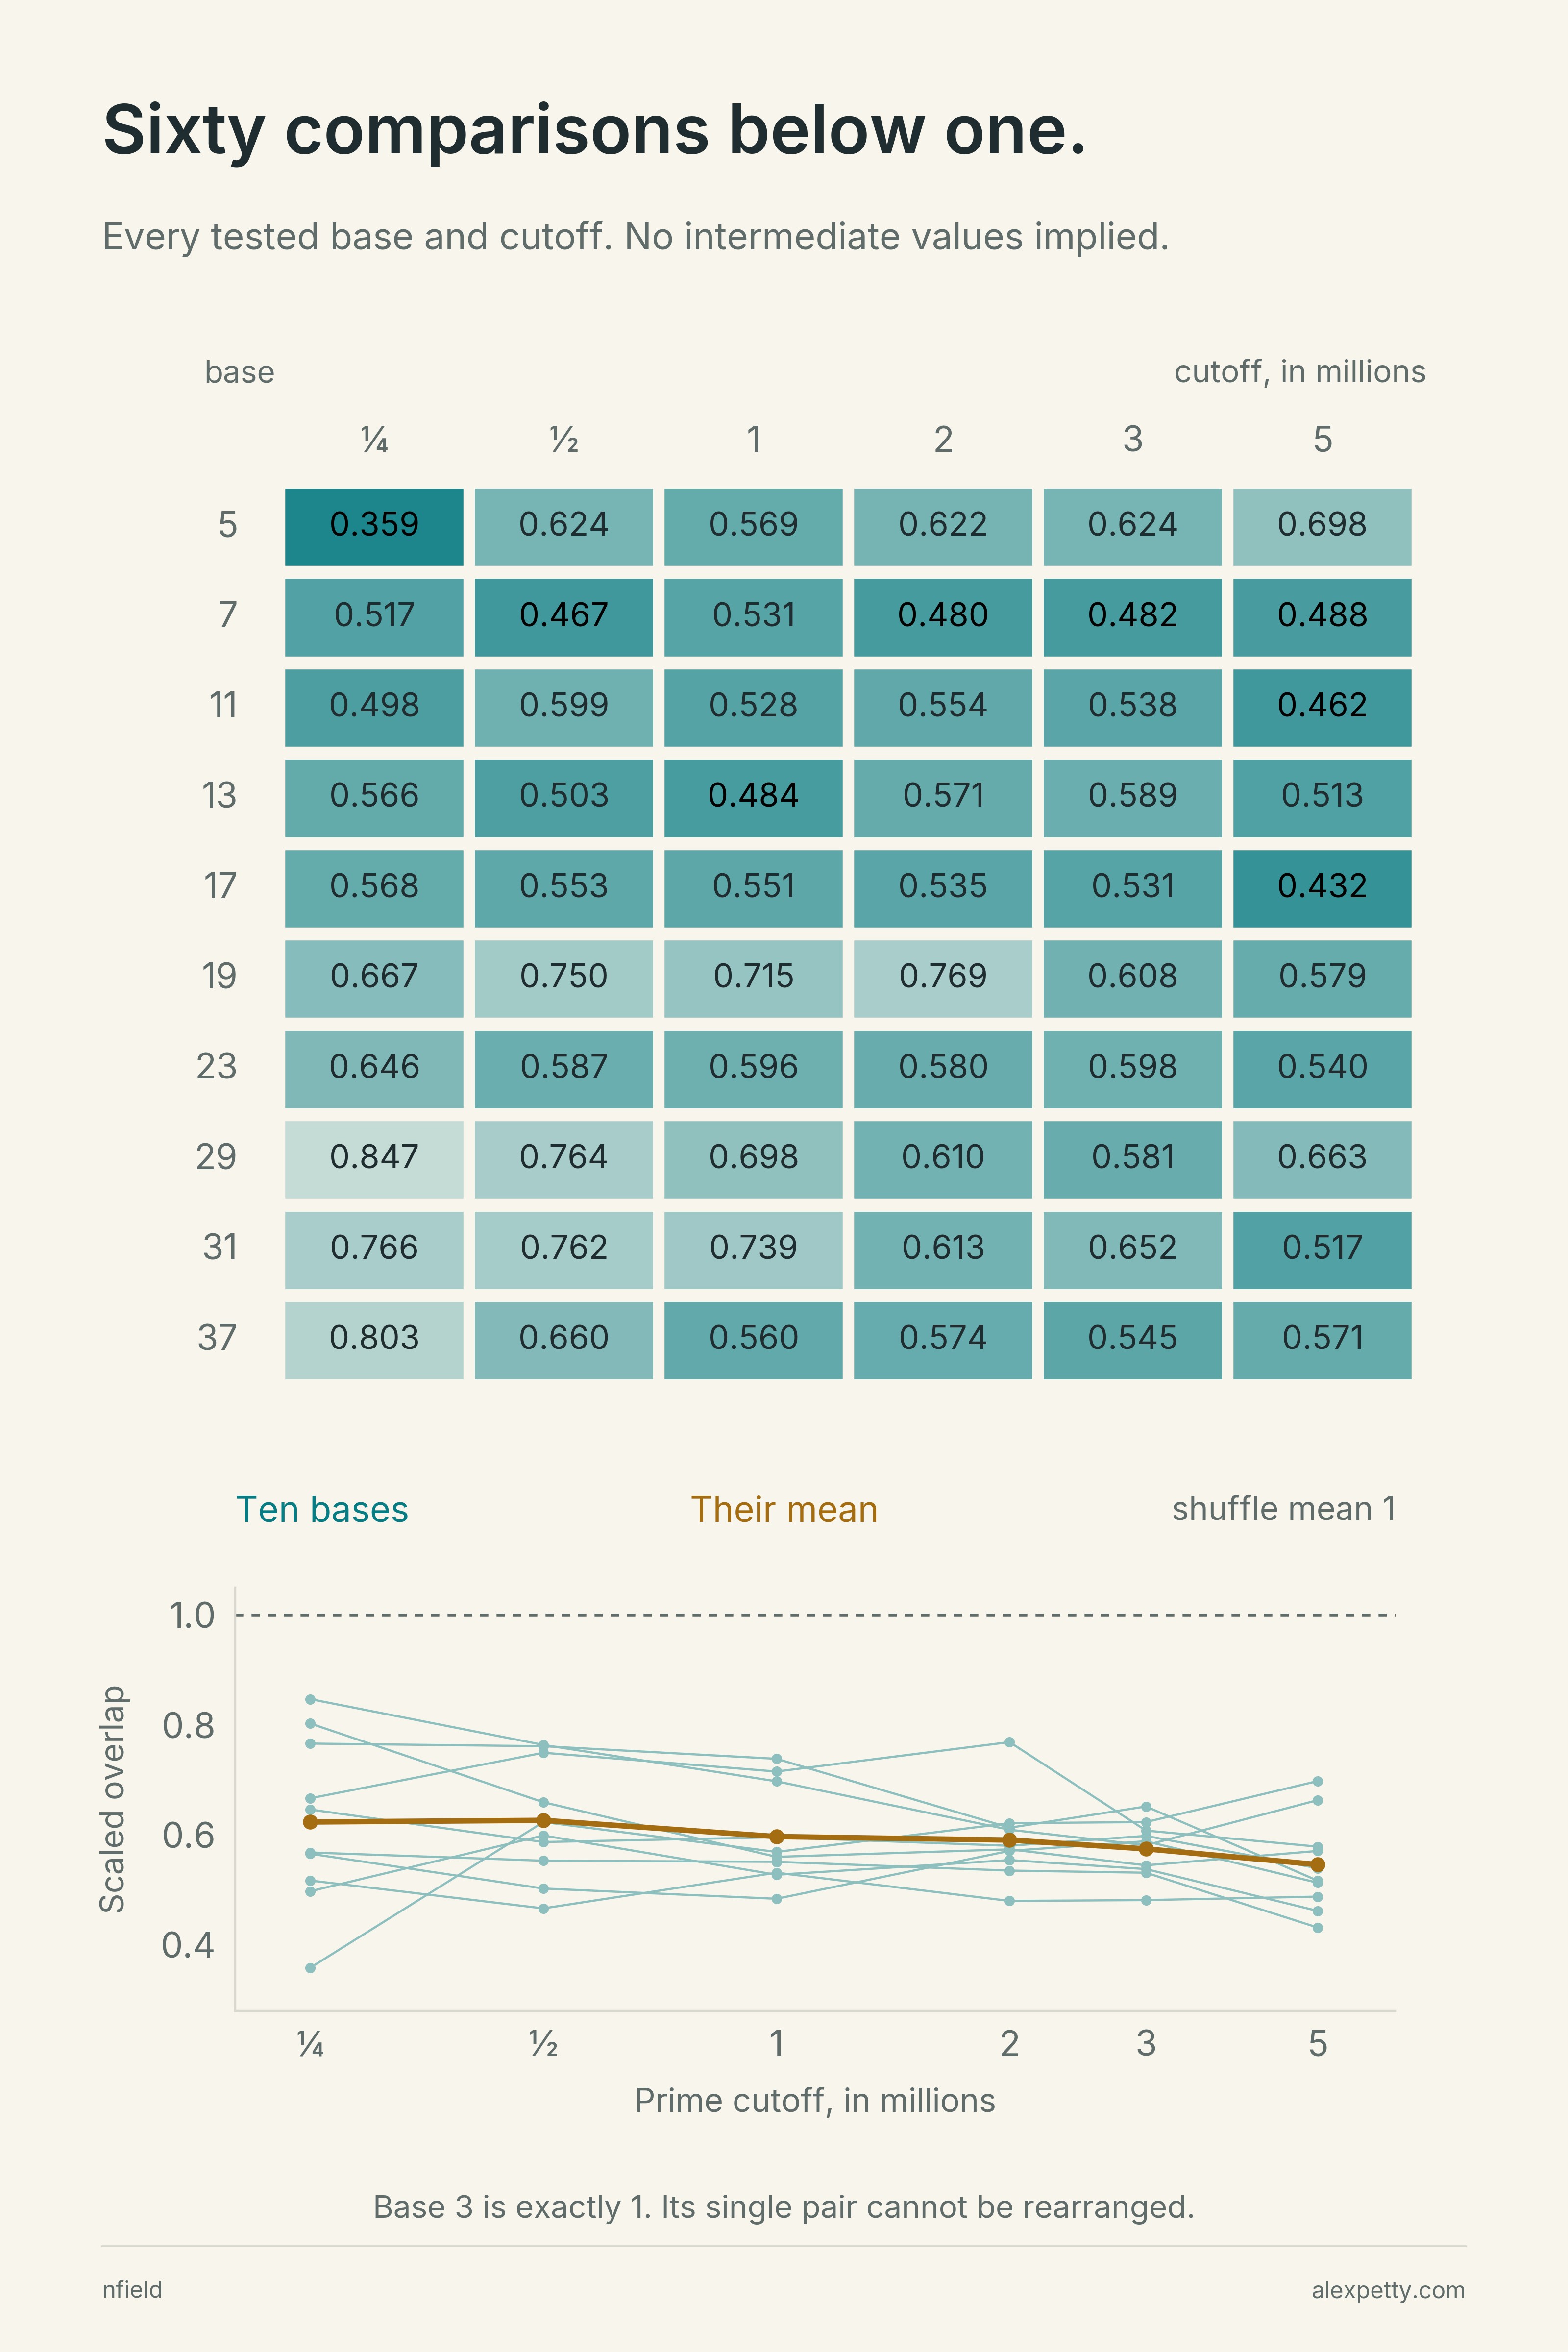
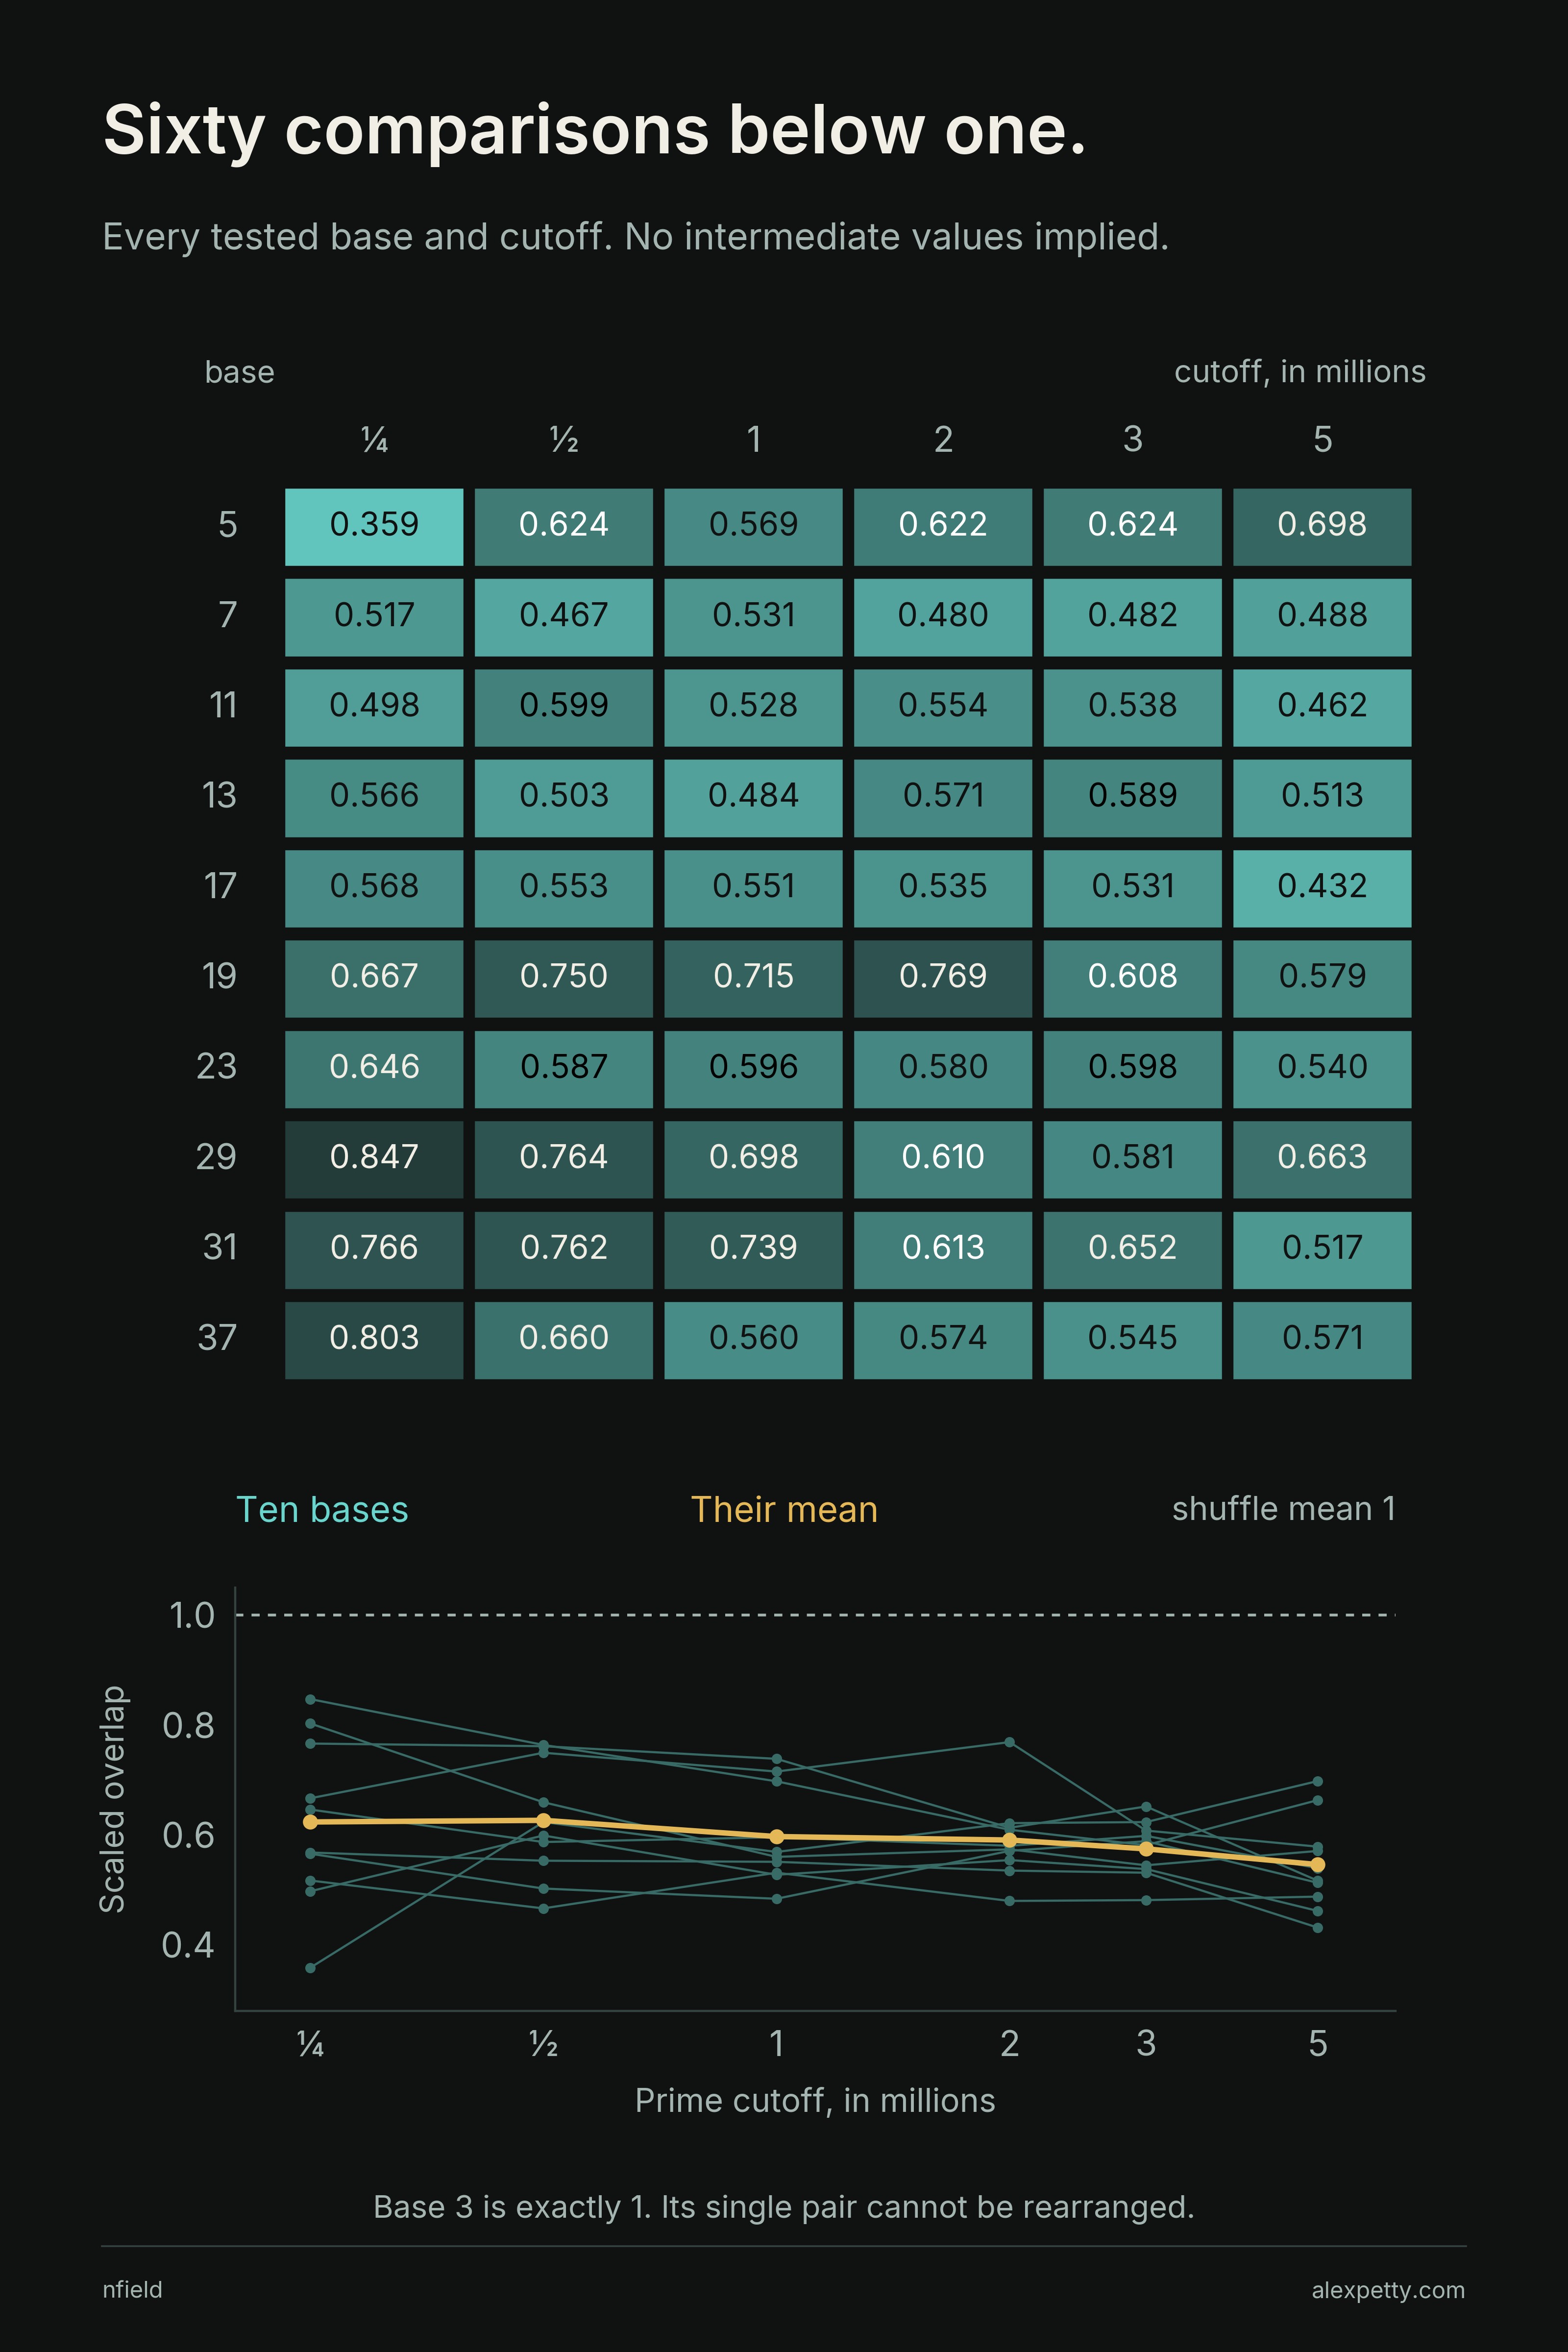
Every one of the sixty cells in the grid is below one. The darkest, the deepest shortfall, is base five at a quarter million, . The palest is base twenty-nine at the same cutoff, , and even that falls well short of one. In the lower plot the ten thin lines cross and recross as the cutoff grows. The gold mean barely moves, and at the first two cutoffs and then down to at five million.
The windows share most of their primes. These are sixty overlapping looks at one sequence, and a common sign across them proves no infinite law. Base three sits outside the grid. It has a single eligible pair and nothing to rearrange, so its ratio is exactly one. Counting the excluded characters as well would mix two effects, how much prime weight reaches the eligible pairs and how that weight is placed among them, and The Spectral Repulsion separates the two exactly.
All sixty values and the exact shuffle variance
Each entry uses primes strictly between the square of its base and the column’s cutoff. The ratios are rounded to six decimal places.
| Base / cutoff | 250,000 | 500,000 | 1,000,000 | 2,000,000 | 3,000,000 | 5,000,000 |
|---|---|---|---|---|---|---|
| 5 | 0.358604 | 0.623585 | 0.569230 | 0.621637 | 0.623558 | 0.698186 |
| 7 | 0.517232 | 0.466571 | 0.531456 | 0.480109 | 0.481618 | 0.487967 |
| 11 | 0.497731 | 0.599124 | 0.527714 | 0.554413 | 0.538091 | 0.461928 |
| 13 | 0.565944 | 0.502696 | 0.484069 | 0.571188 | 0.588751 | 0.513094 |
| 17 | 0.568194 | 0.553257 | 0.551279 | 0.535310 | 0.531447 | 0.431643 |
| 19 | 0.666823 | 0.749630 | 0.715464 | 0.769019 | 0.608098 | 0.578852 |
| 23 | 0.646340 | 0.587253 | 0.595957 | 0.580464 | 0.598449 | 0.539563 |
| 29 | 0.847195 | 0.763904 | 0.697677 | 0.609580 | 0.581497 | 0.663482 |
| 31 | 0.766327 | 0.761552 | 0.738612 | 0.613236 | 0.651921 | 0.516871 |
| 37 | 0.802902 | 0.659609 | 0.560271 | 0.573913 | 0.544948 | 0.571037 |
For a uniformly chosen permutation , put . When , its mean and variance are
The variance is exact for these two lists. One shuffled entry has the list’s mean-square deviation. Two distinct shuffled entries have negative covariance because they cannot occupy the same position. Expanding the square of the weighted sum gives the formula.
At two million, base five sits shuffle standard deviations below one. Base thirty-seven sits below. Both distances are measured in the relabeling distribution. A single pair has zero variance.
Sixteen pairs, seventy percent
The two rows also differ in shape. At base thirty-seven there are pairs. Order them once by collision weight and keep the prime row in that same order.
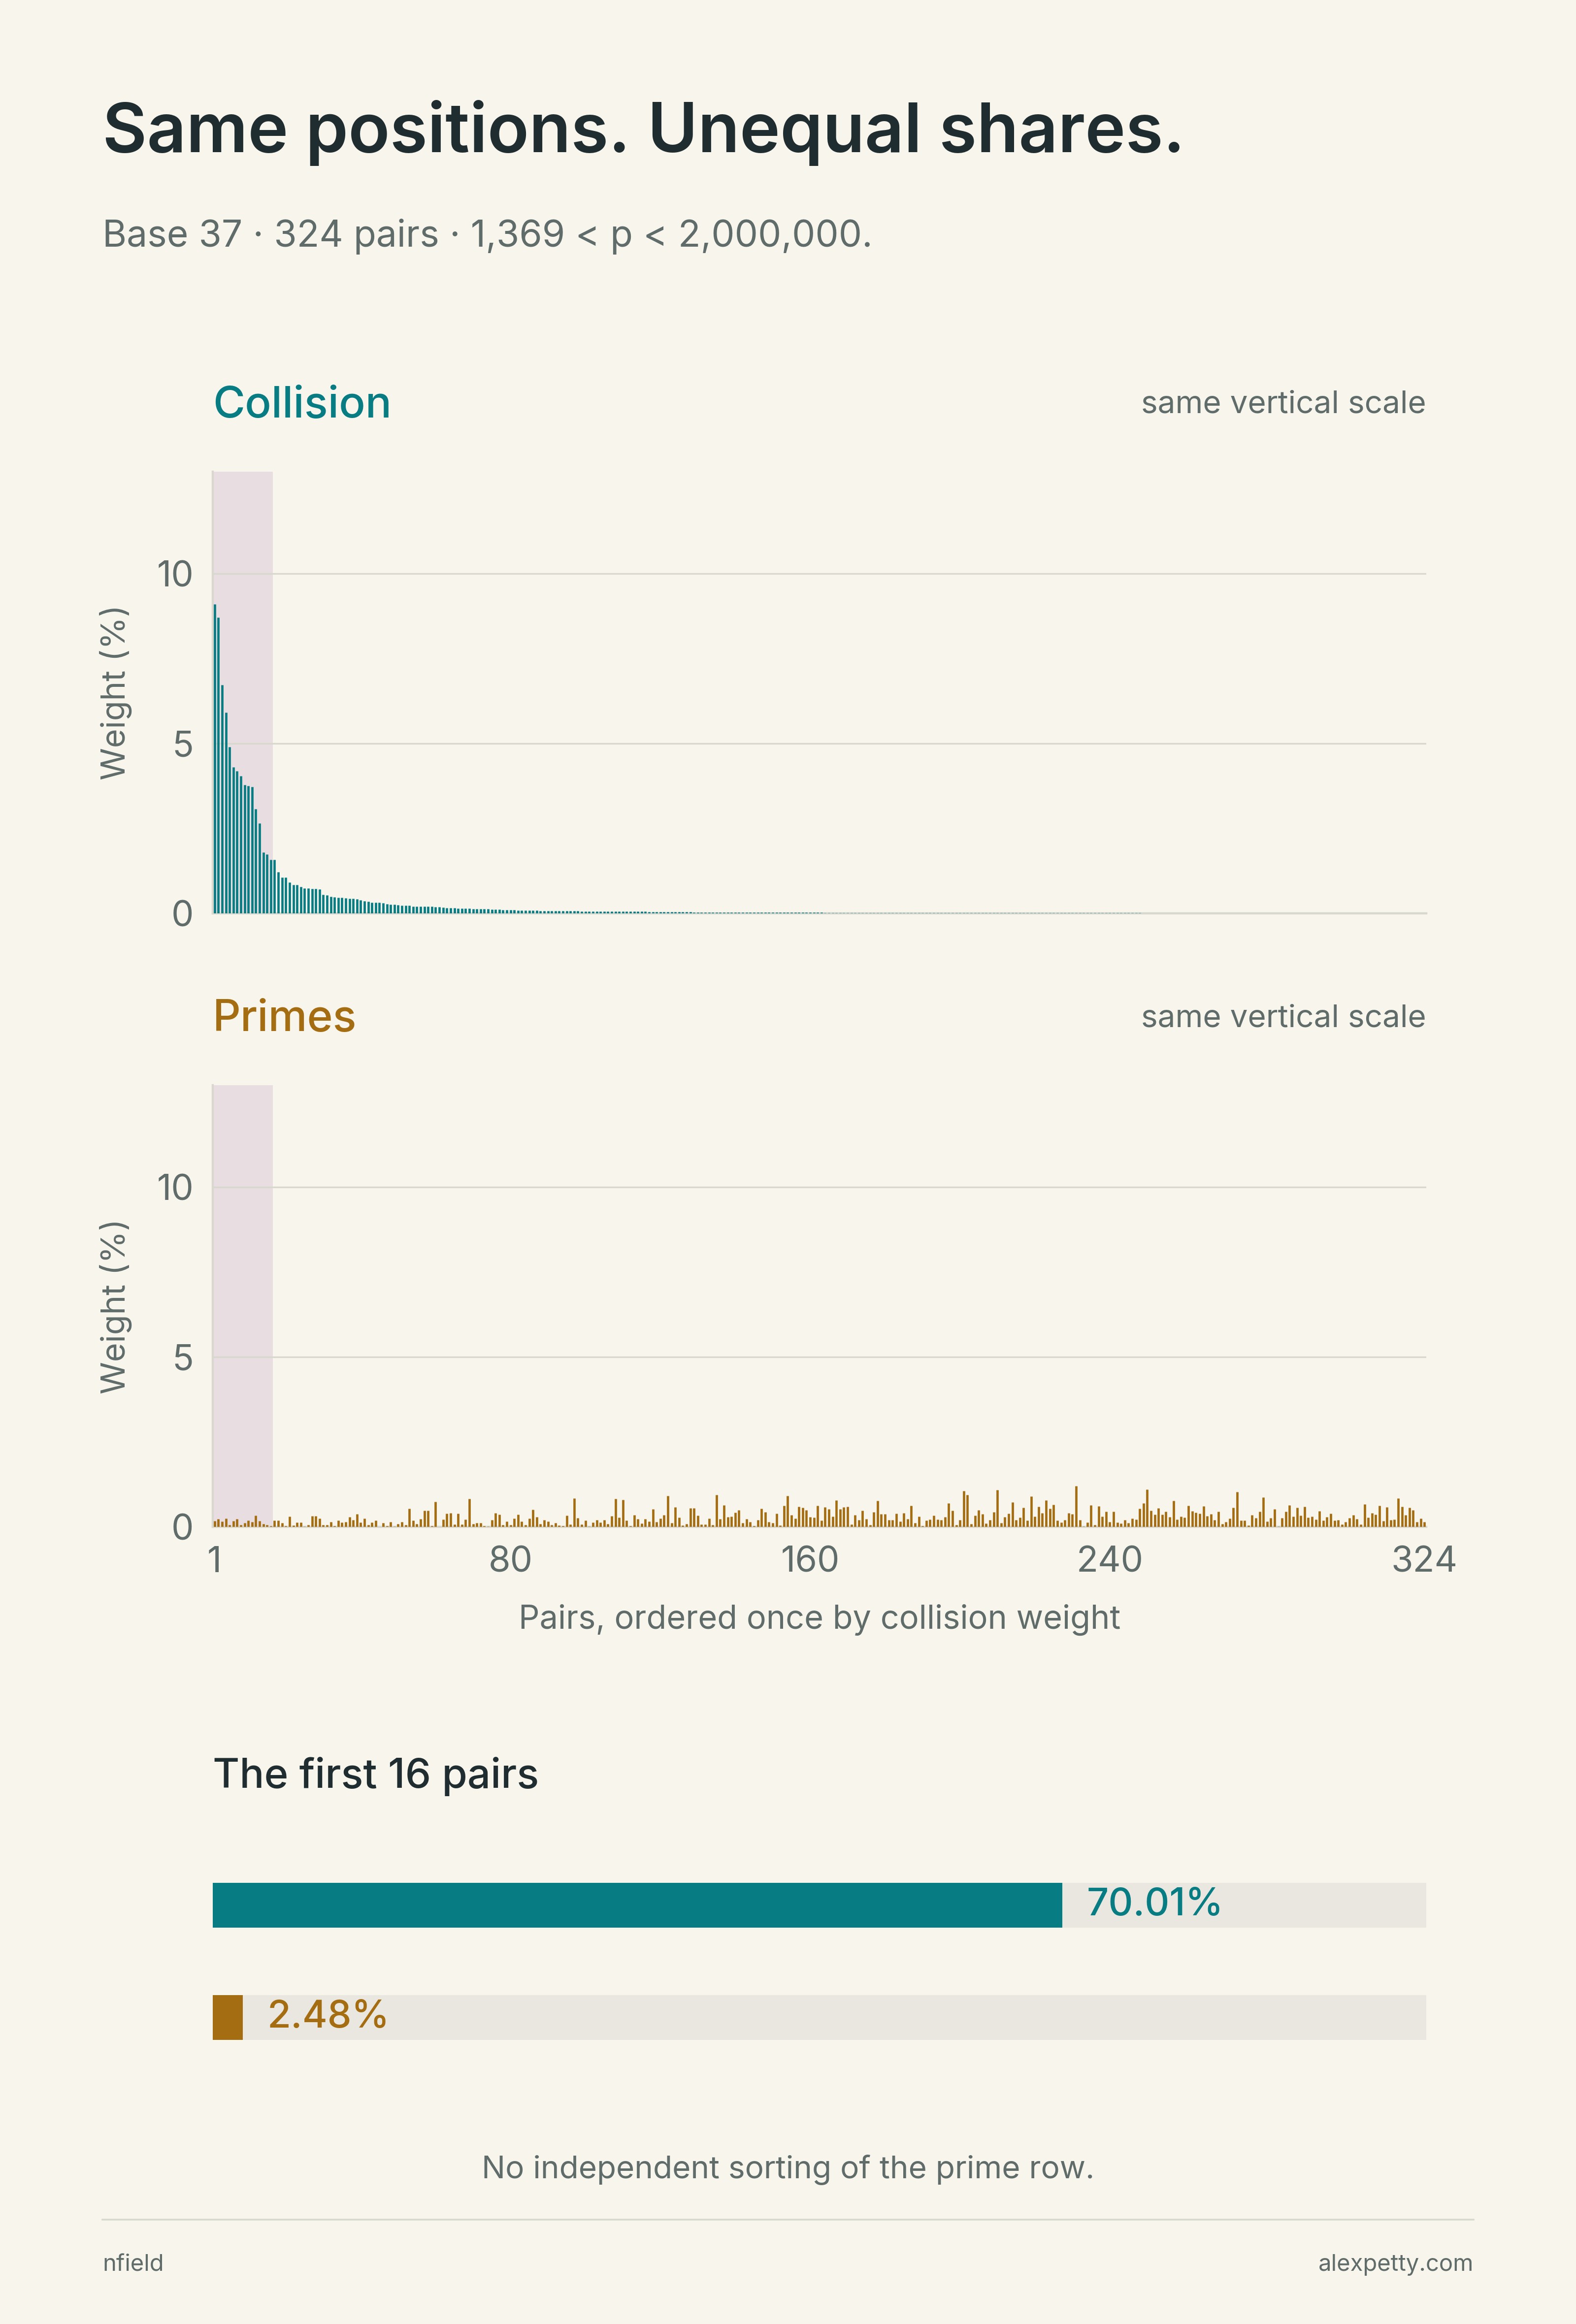
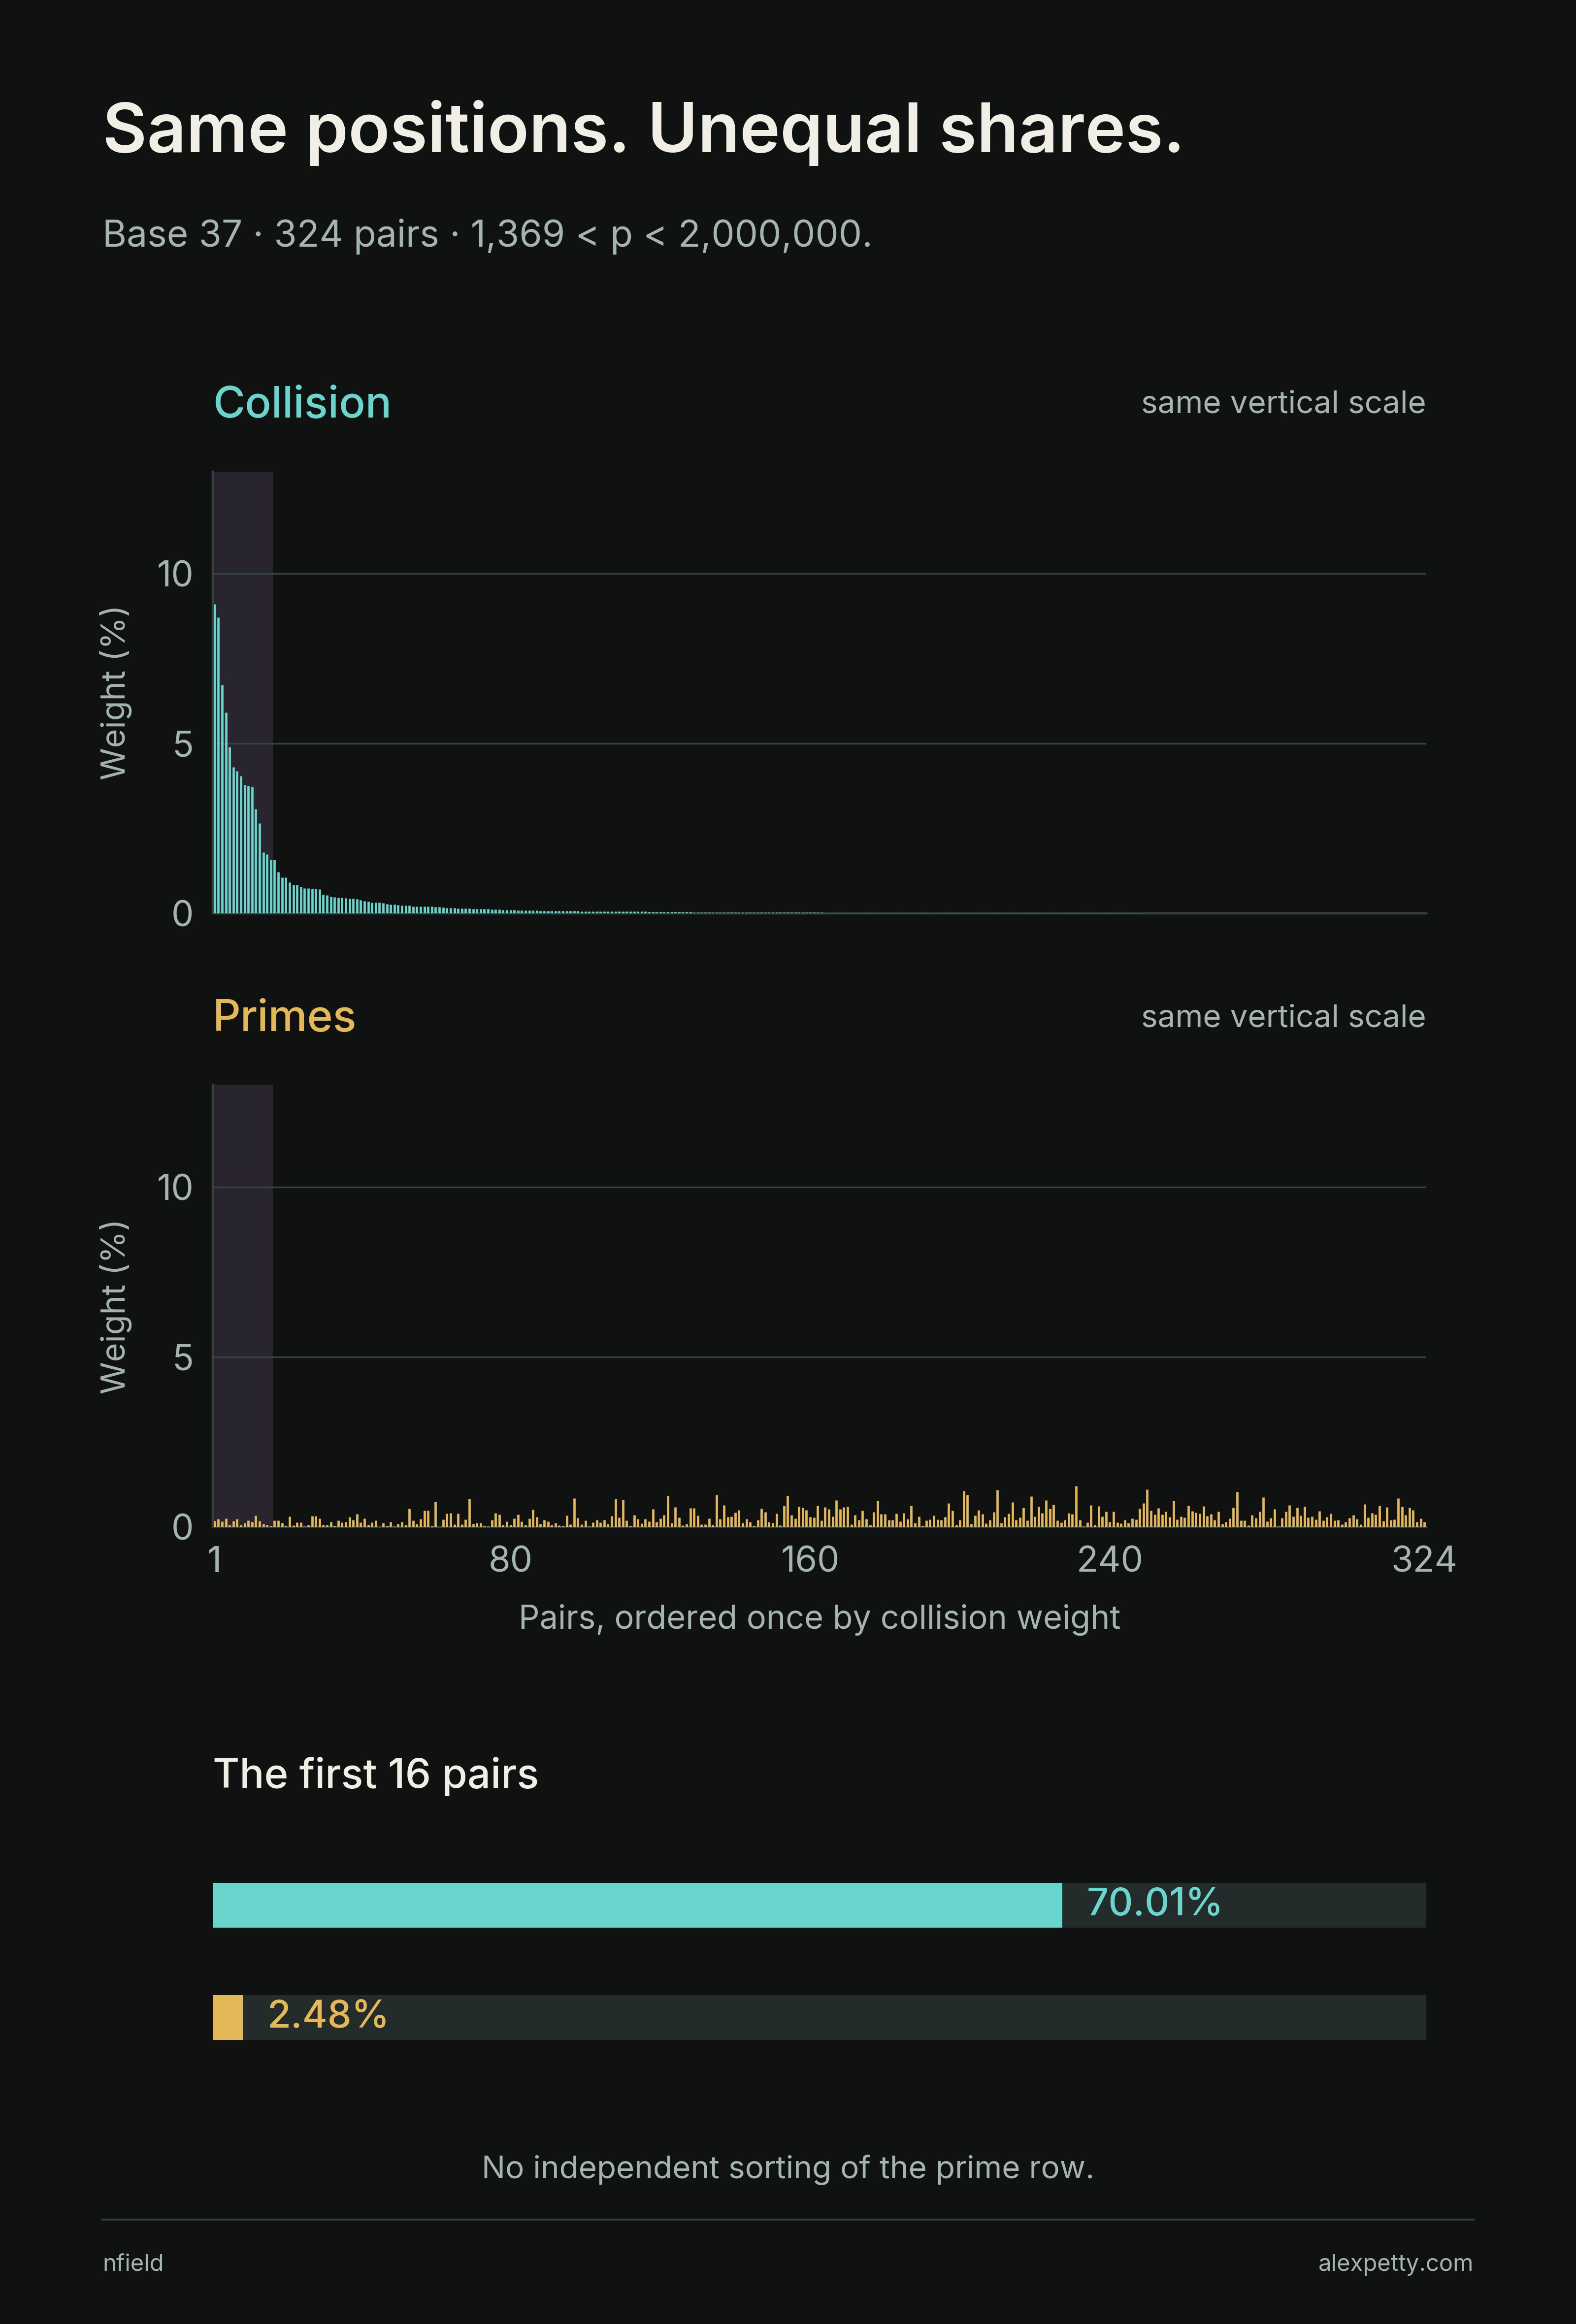
The teal spike at the left is the collision row, nearly all of it in the first few dozen pairs. The shaded first sixteen hold percent. The gold row in the same positions is almost flat, percent for those sixteen, and its tallest bars are scattered far to the right, out where the collision weight has thinned to nothing.
Spread can also be measured with the positions thrown away. The effective support of a row is the number of equal weights with the same entropy. Four equal weights give four and one occupied position gives one, while unequal weights can land between integers.
| Base | Eligible characters | Collision support | Prime support |
|---|---|---|---|
| 5 | 8 | 4.59 | 5.21 |
| 13 | 72 | 17.97 | 49.71 |
| 29 | 392 | 63.95 | 290.02 |
| 37 | 648 | 92.05 | 493.73 |
The supports count individual characters, both members of every pair. At base twenty-nine the collision weights have the entropy of about sixty-four equal weights and the prime weights about two hundred and ninety. A concentrated row can still put its biggest weight opposite the biggest weight in a broad row, so concentration alone can’t make the overlap small. That is the reason for shuffling. Both rows keep their shapes, only the partners change, and the real partners still come in low.
A partner with the opposite sign
The same table answers a different kind of question about pairs. Instead of matching characters, match remainders that add to a chosen target. The base-three table fits in nine places, with nonunit remainders given weight zero.
| Remainder | 0 | 1 | 2 | 3 | 4 | 5 | 6 | 7 | 8 |
|---|---|---|---|---|---|---|---|---|---|
| Weight | 0 | 2/3 | 4/3 | 0 | 2/3 | −2/3 | 0 | −4/3 | −2/3 |
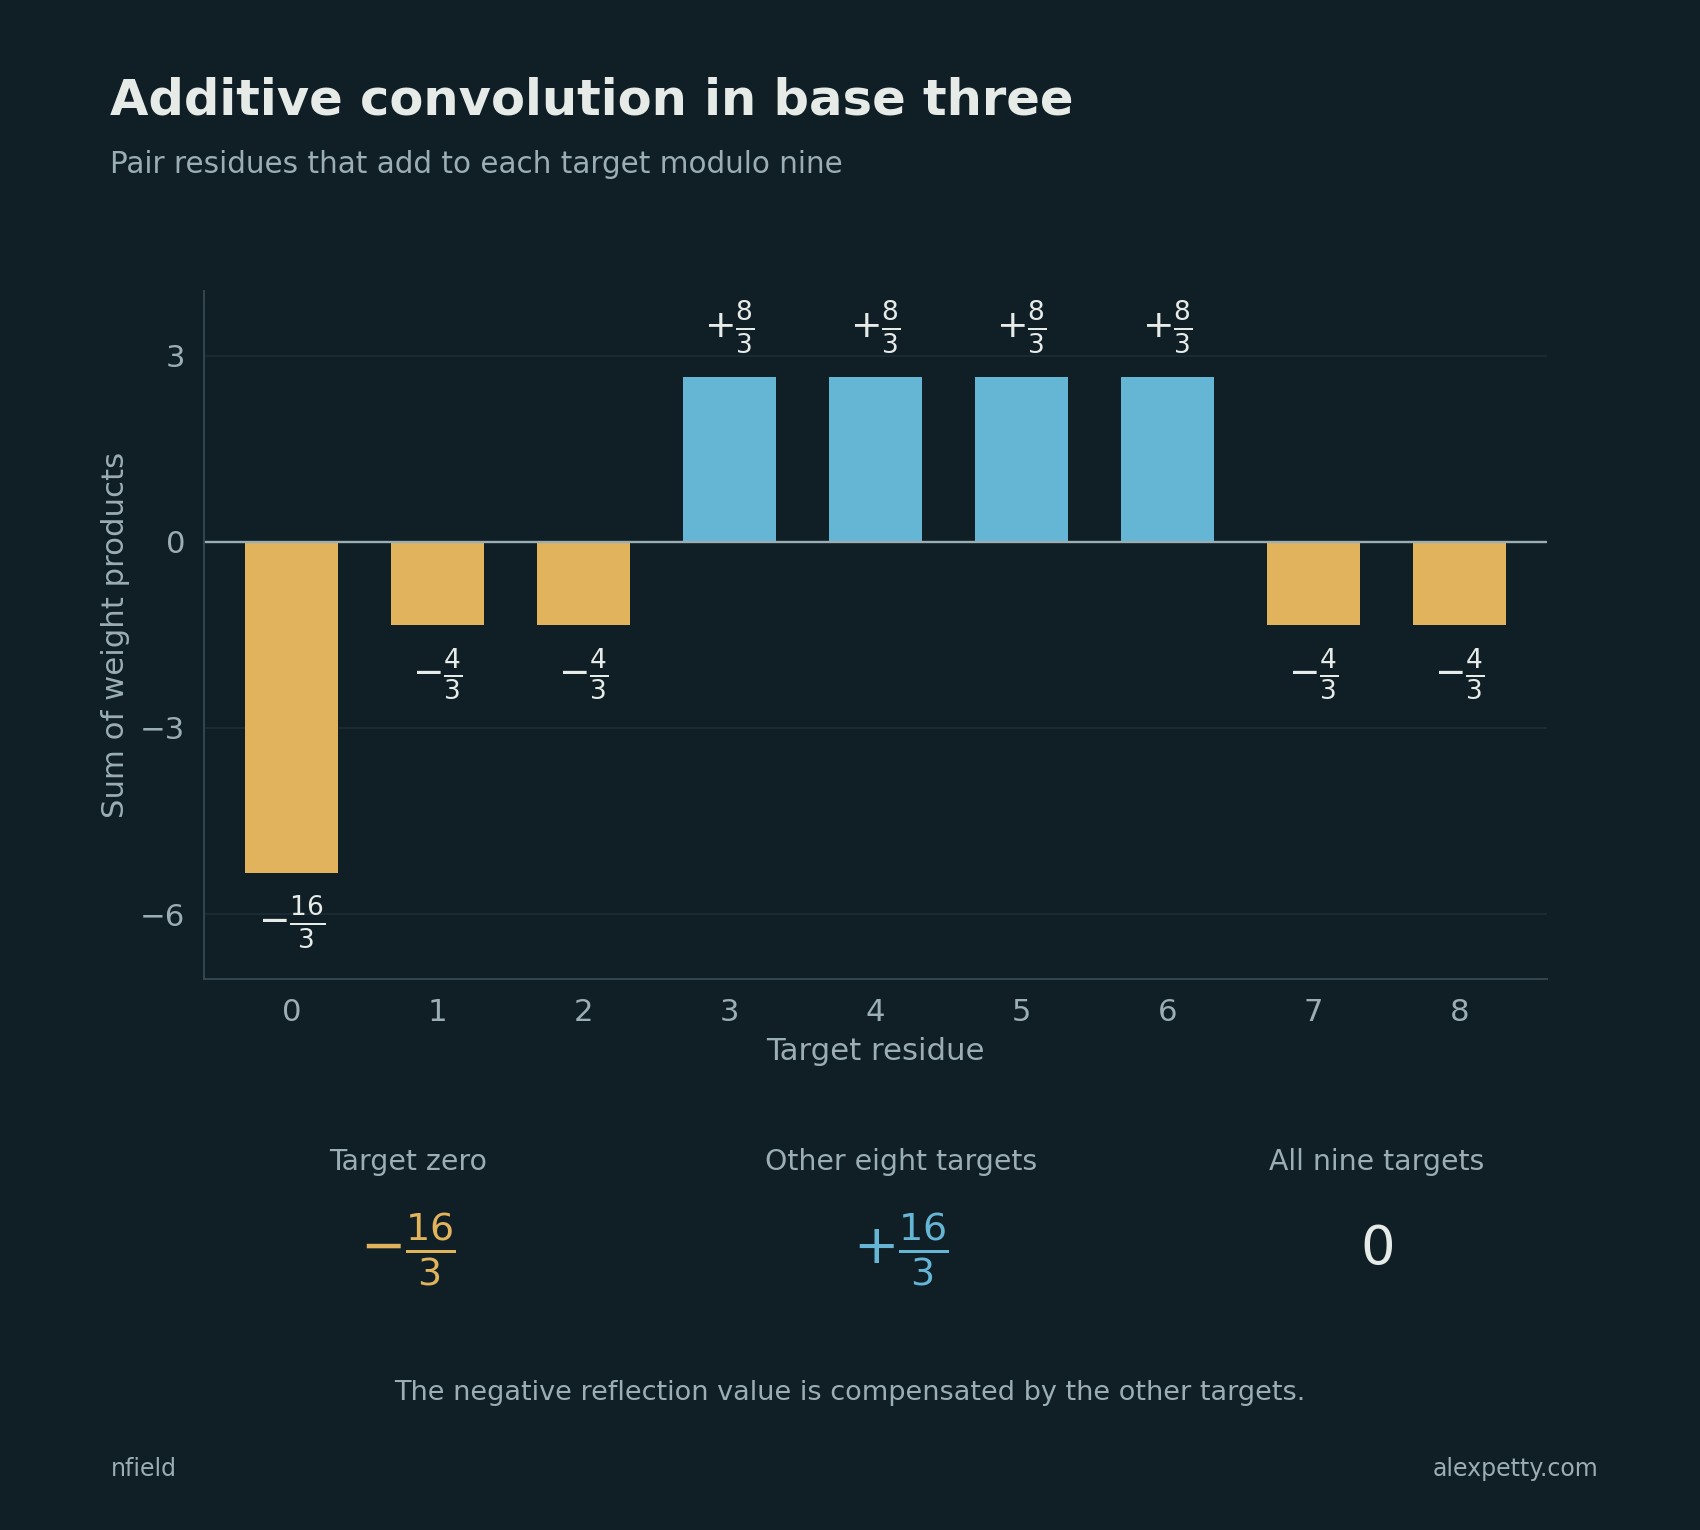
For target zero, one meets eight, two meets seven and four meets five. Each pair carries opposite weights, so every product is a negative square. Counting both orders, the total is . Running every remainder against every target gives the additive convolution
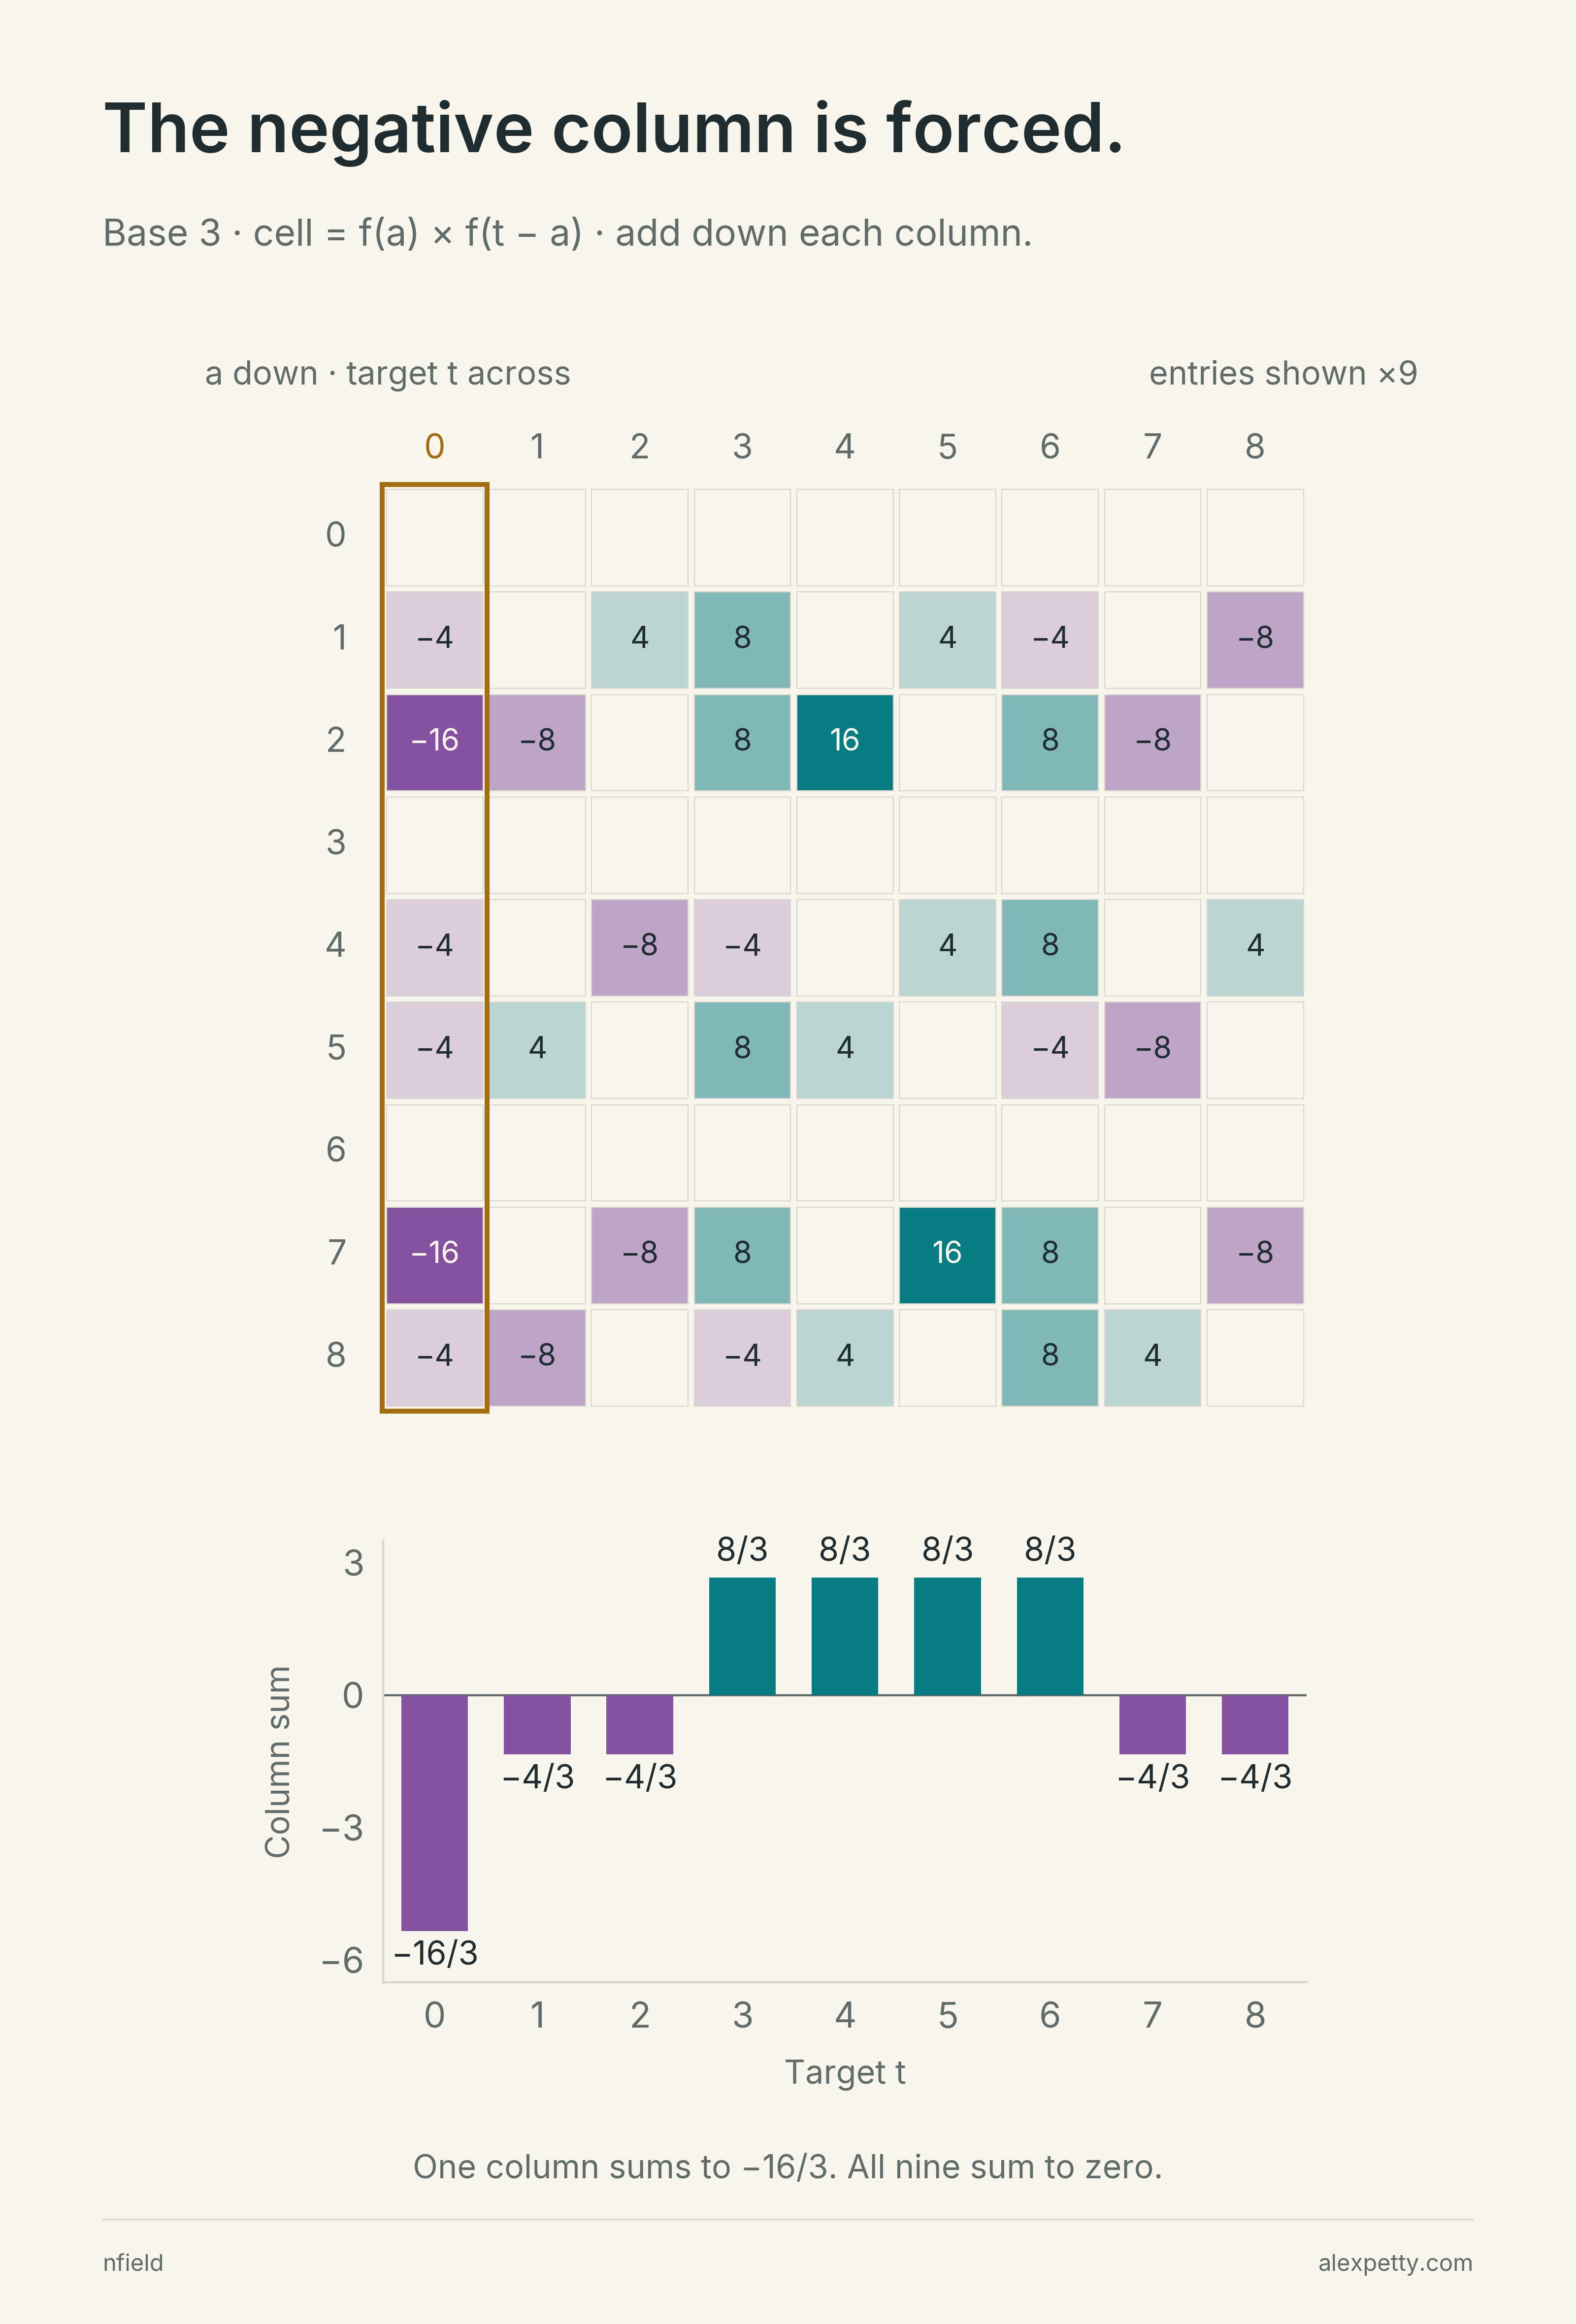
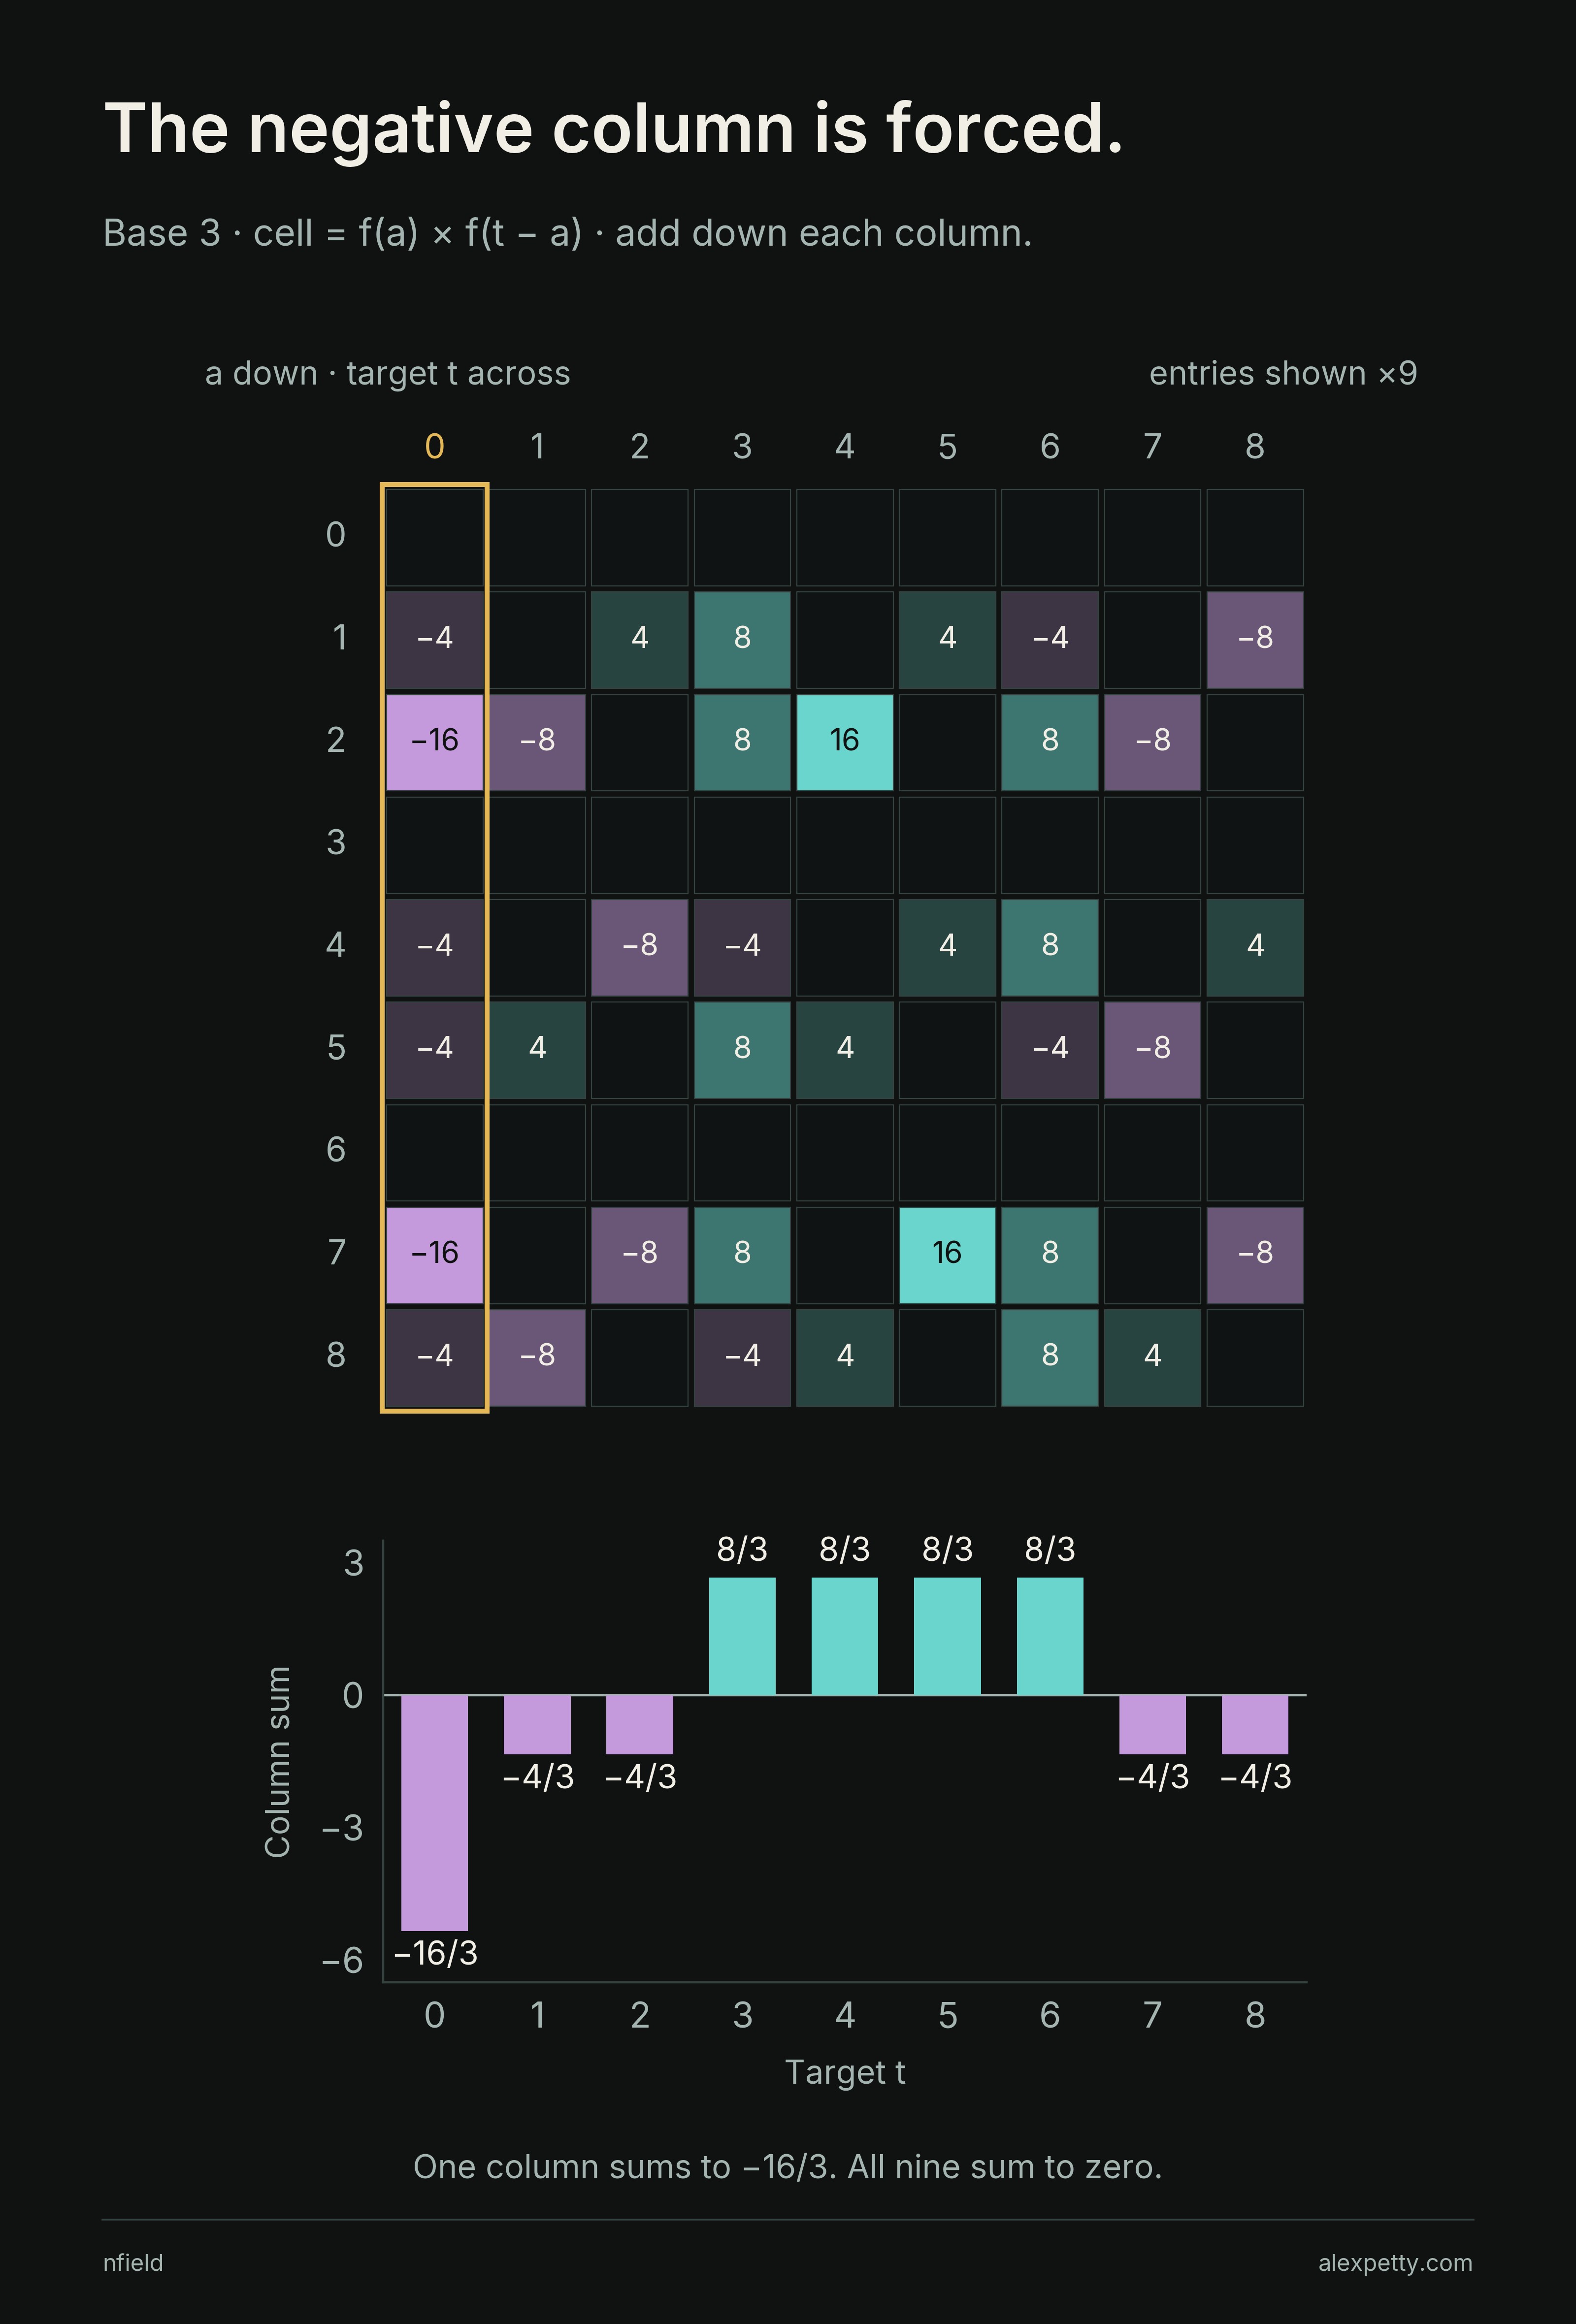
The outlined first column is target zero, and every cell in it is violet or empty, and in ninths. Reflection forces that, because . The bars underneath add each column. Target zero drops to , which is the negative of the table’s energy,
Targets three through six rise to each, targets one, two, seven and eight dip to , and the nine columns together add to exactly zero. The other targets make up for the first column only in total. The first column is the one forced cell by cell.
From nine remainders to 1,369
The same construction below uses bases three, five, seven, ten, nineteen and thirty-seven. Every cell is a product , with down the page and target across. The largest grid contains products. The target-zero column stays nonpositive at every size.
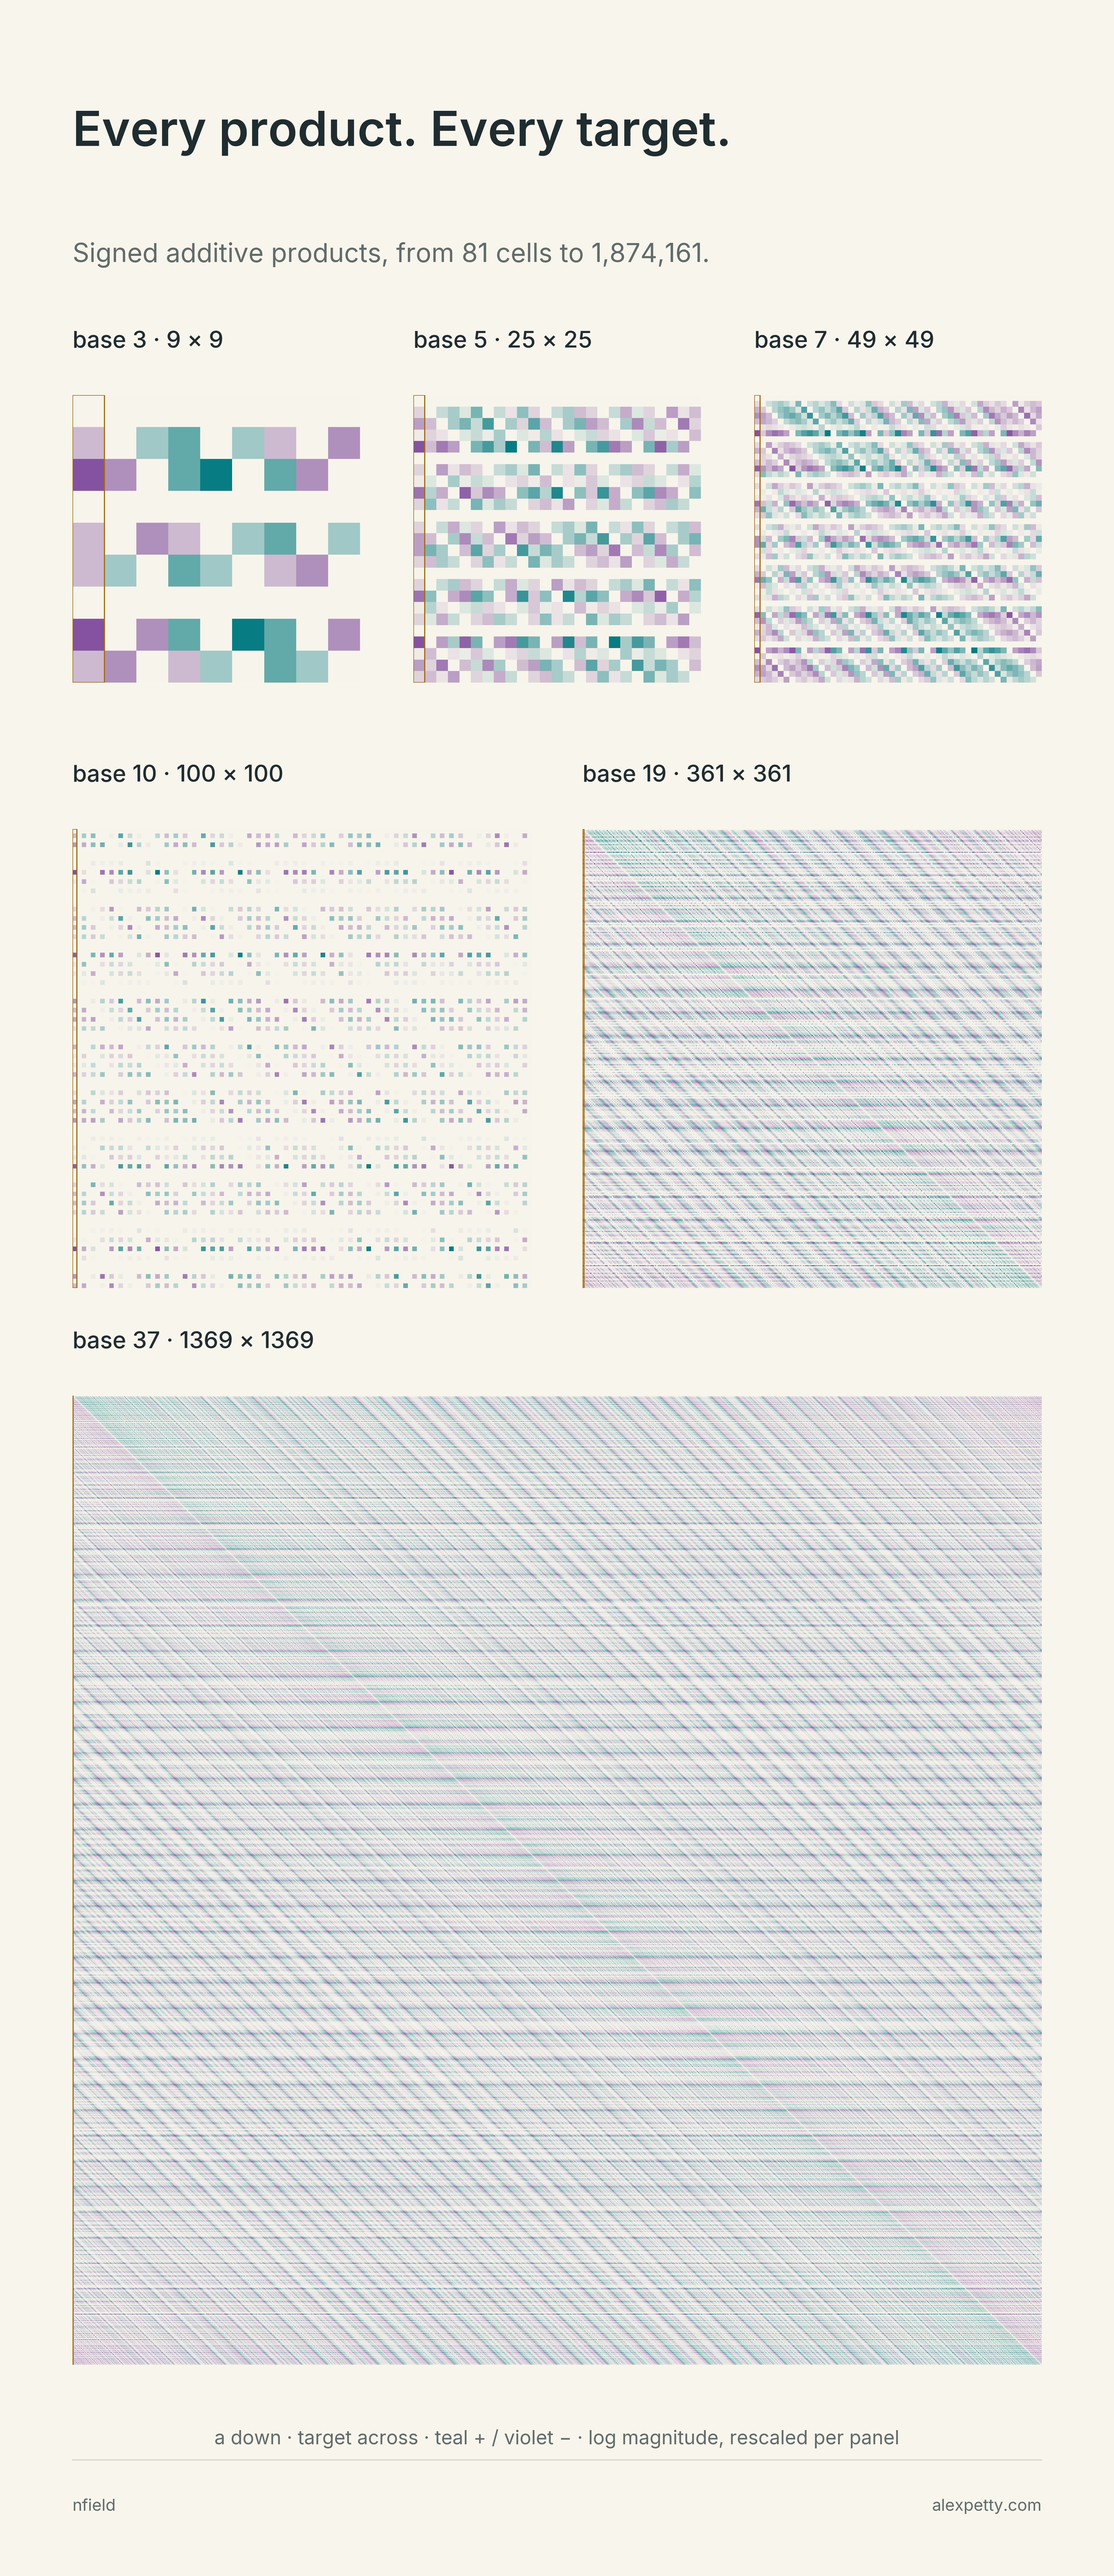
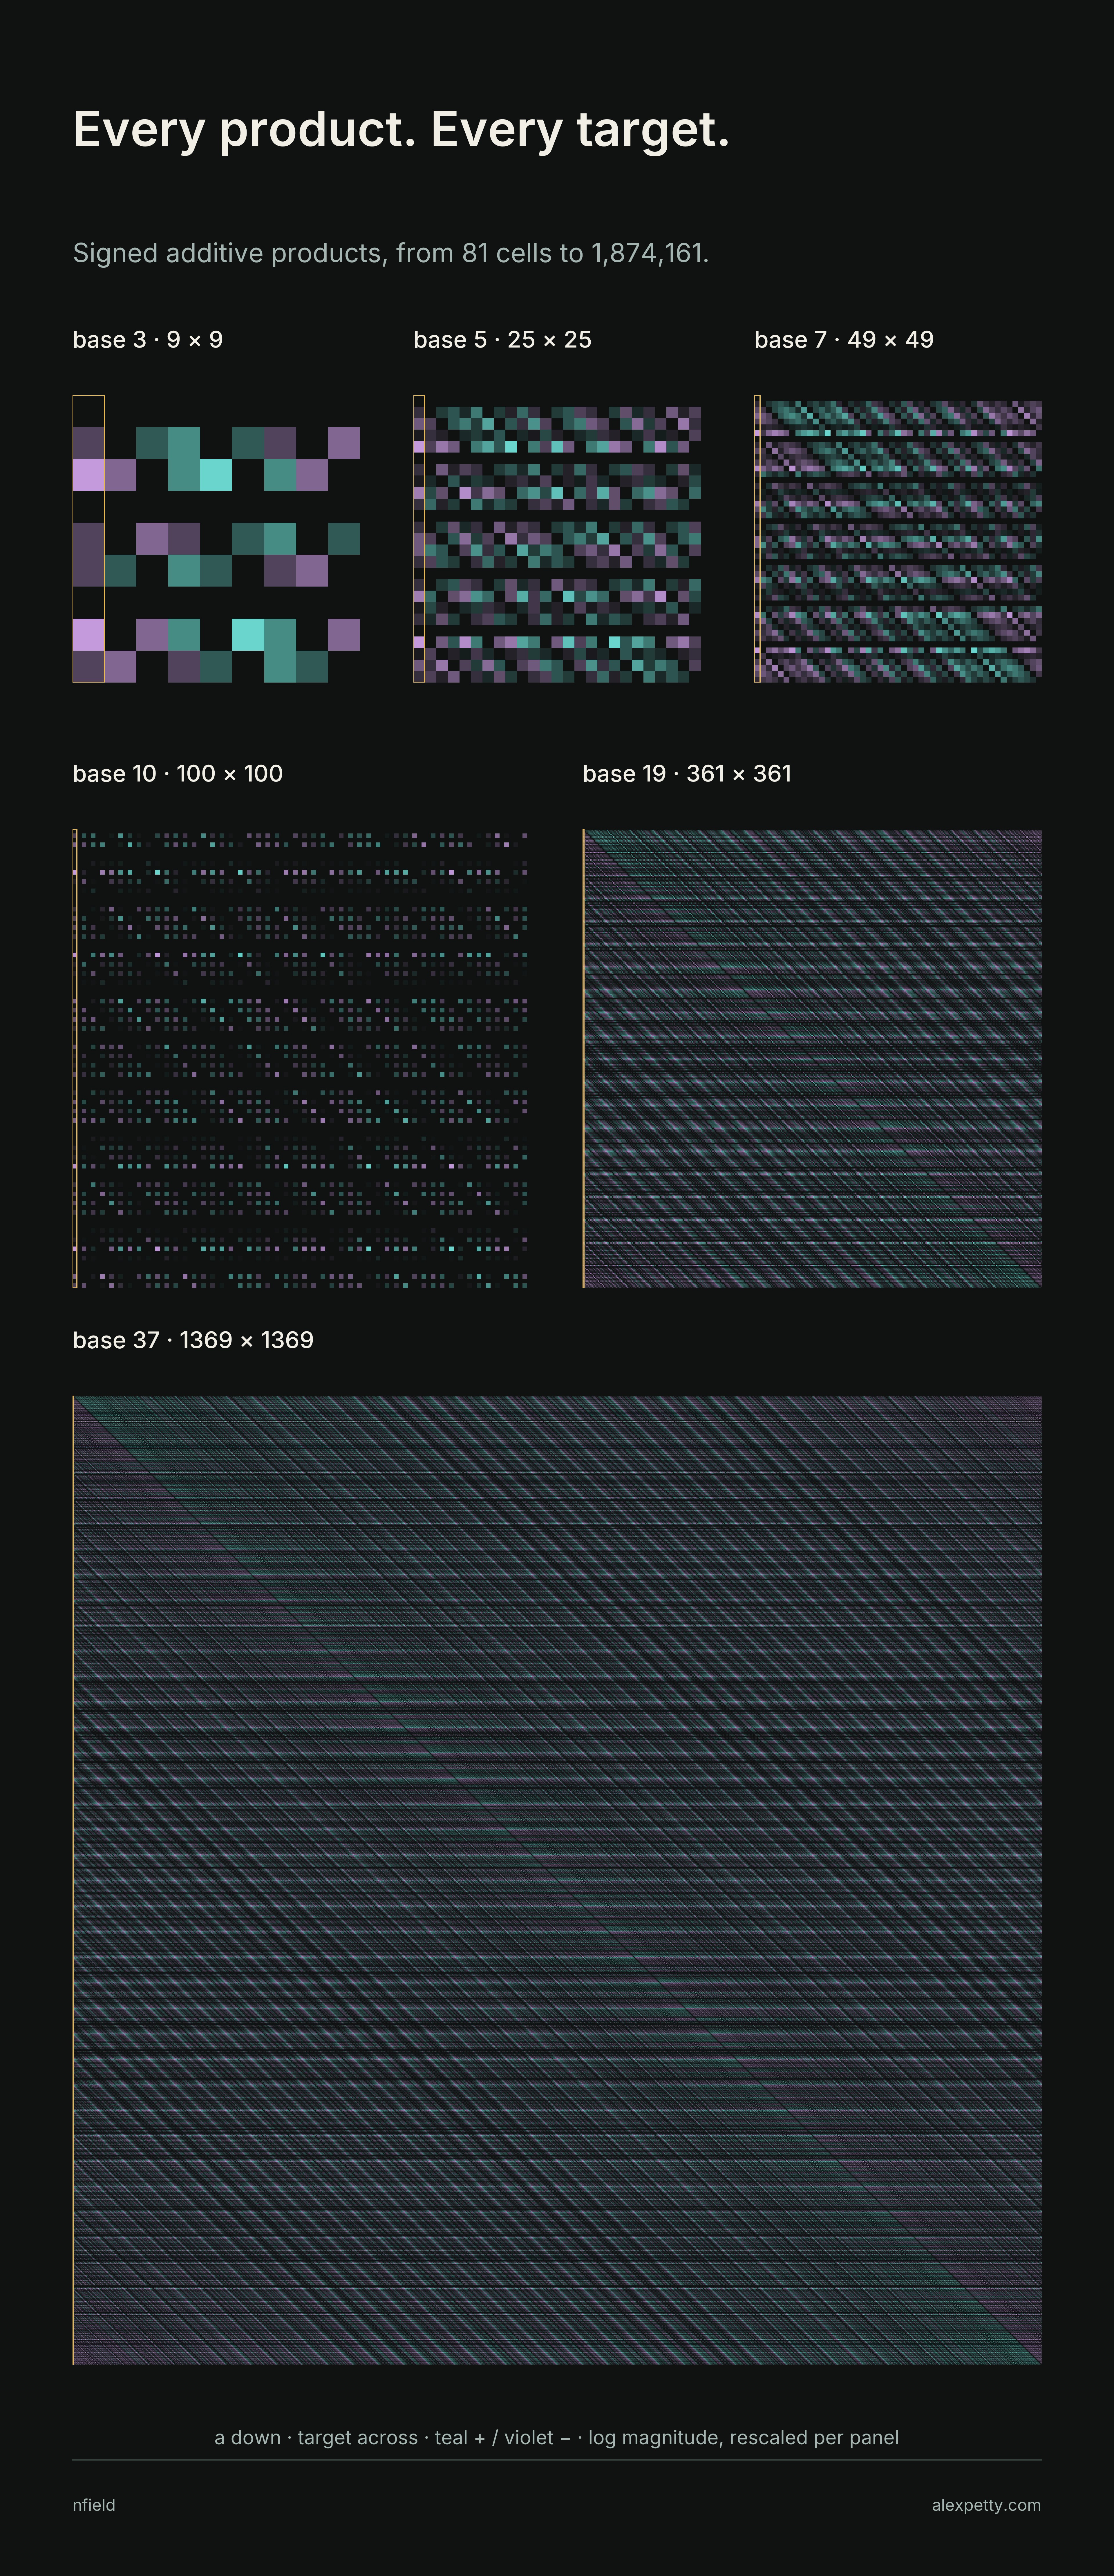
Select the image, choose 100%, and drag to inspect the individual cells. Color retains the sign and uses for intensity, rescaled in each panel. The colors make small products visible; the column sums use the original weights.
The additive Fourier coefficients, all nonpositive
These identities hold for every base , including composite bases. With , the zero extension of is real and odd. Its additive Fourier transform
is purely imaginary. The cosine contributions cancel between and . Convolution becomes multiplication, so
The square of a purely imaginary number is the negative of its squared size, which is where the sign comes from. Also , which proves the compensation without requiring the individual convolution values to vanish.
The sign carries straight over to primes. Thirty-six is a multiple of nine and the sum of four pairs of primes, , , and .
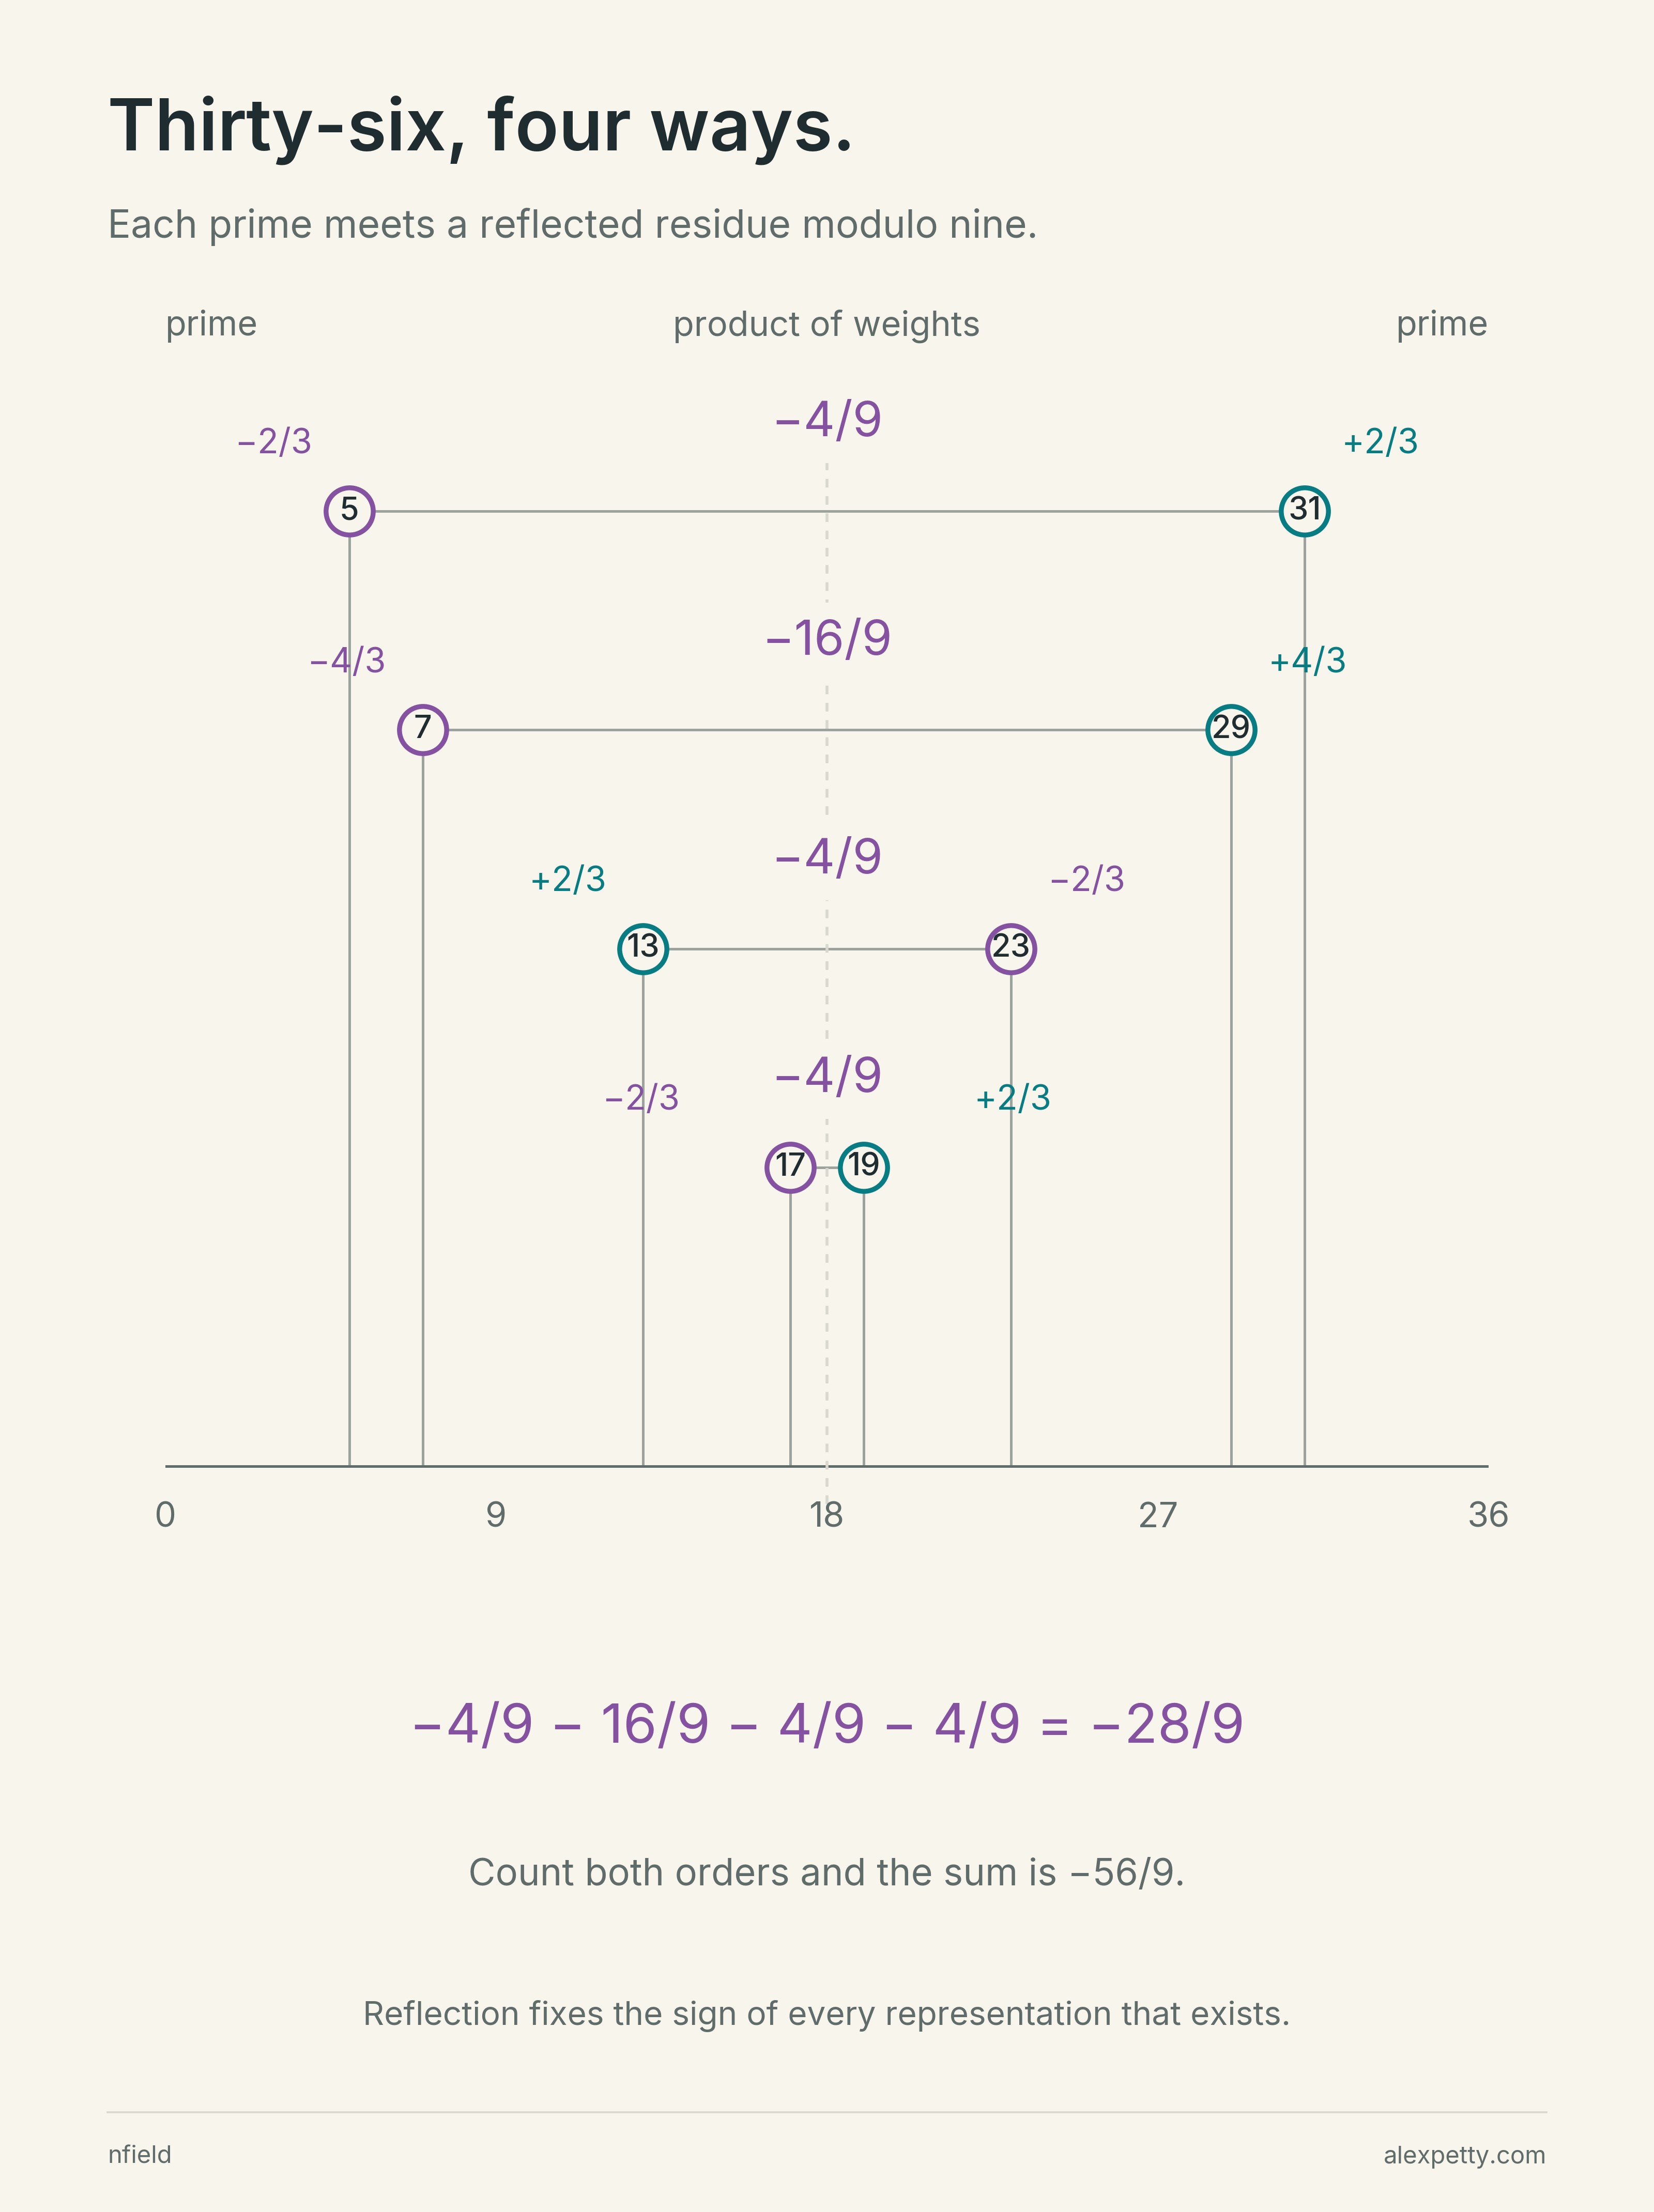
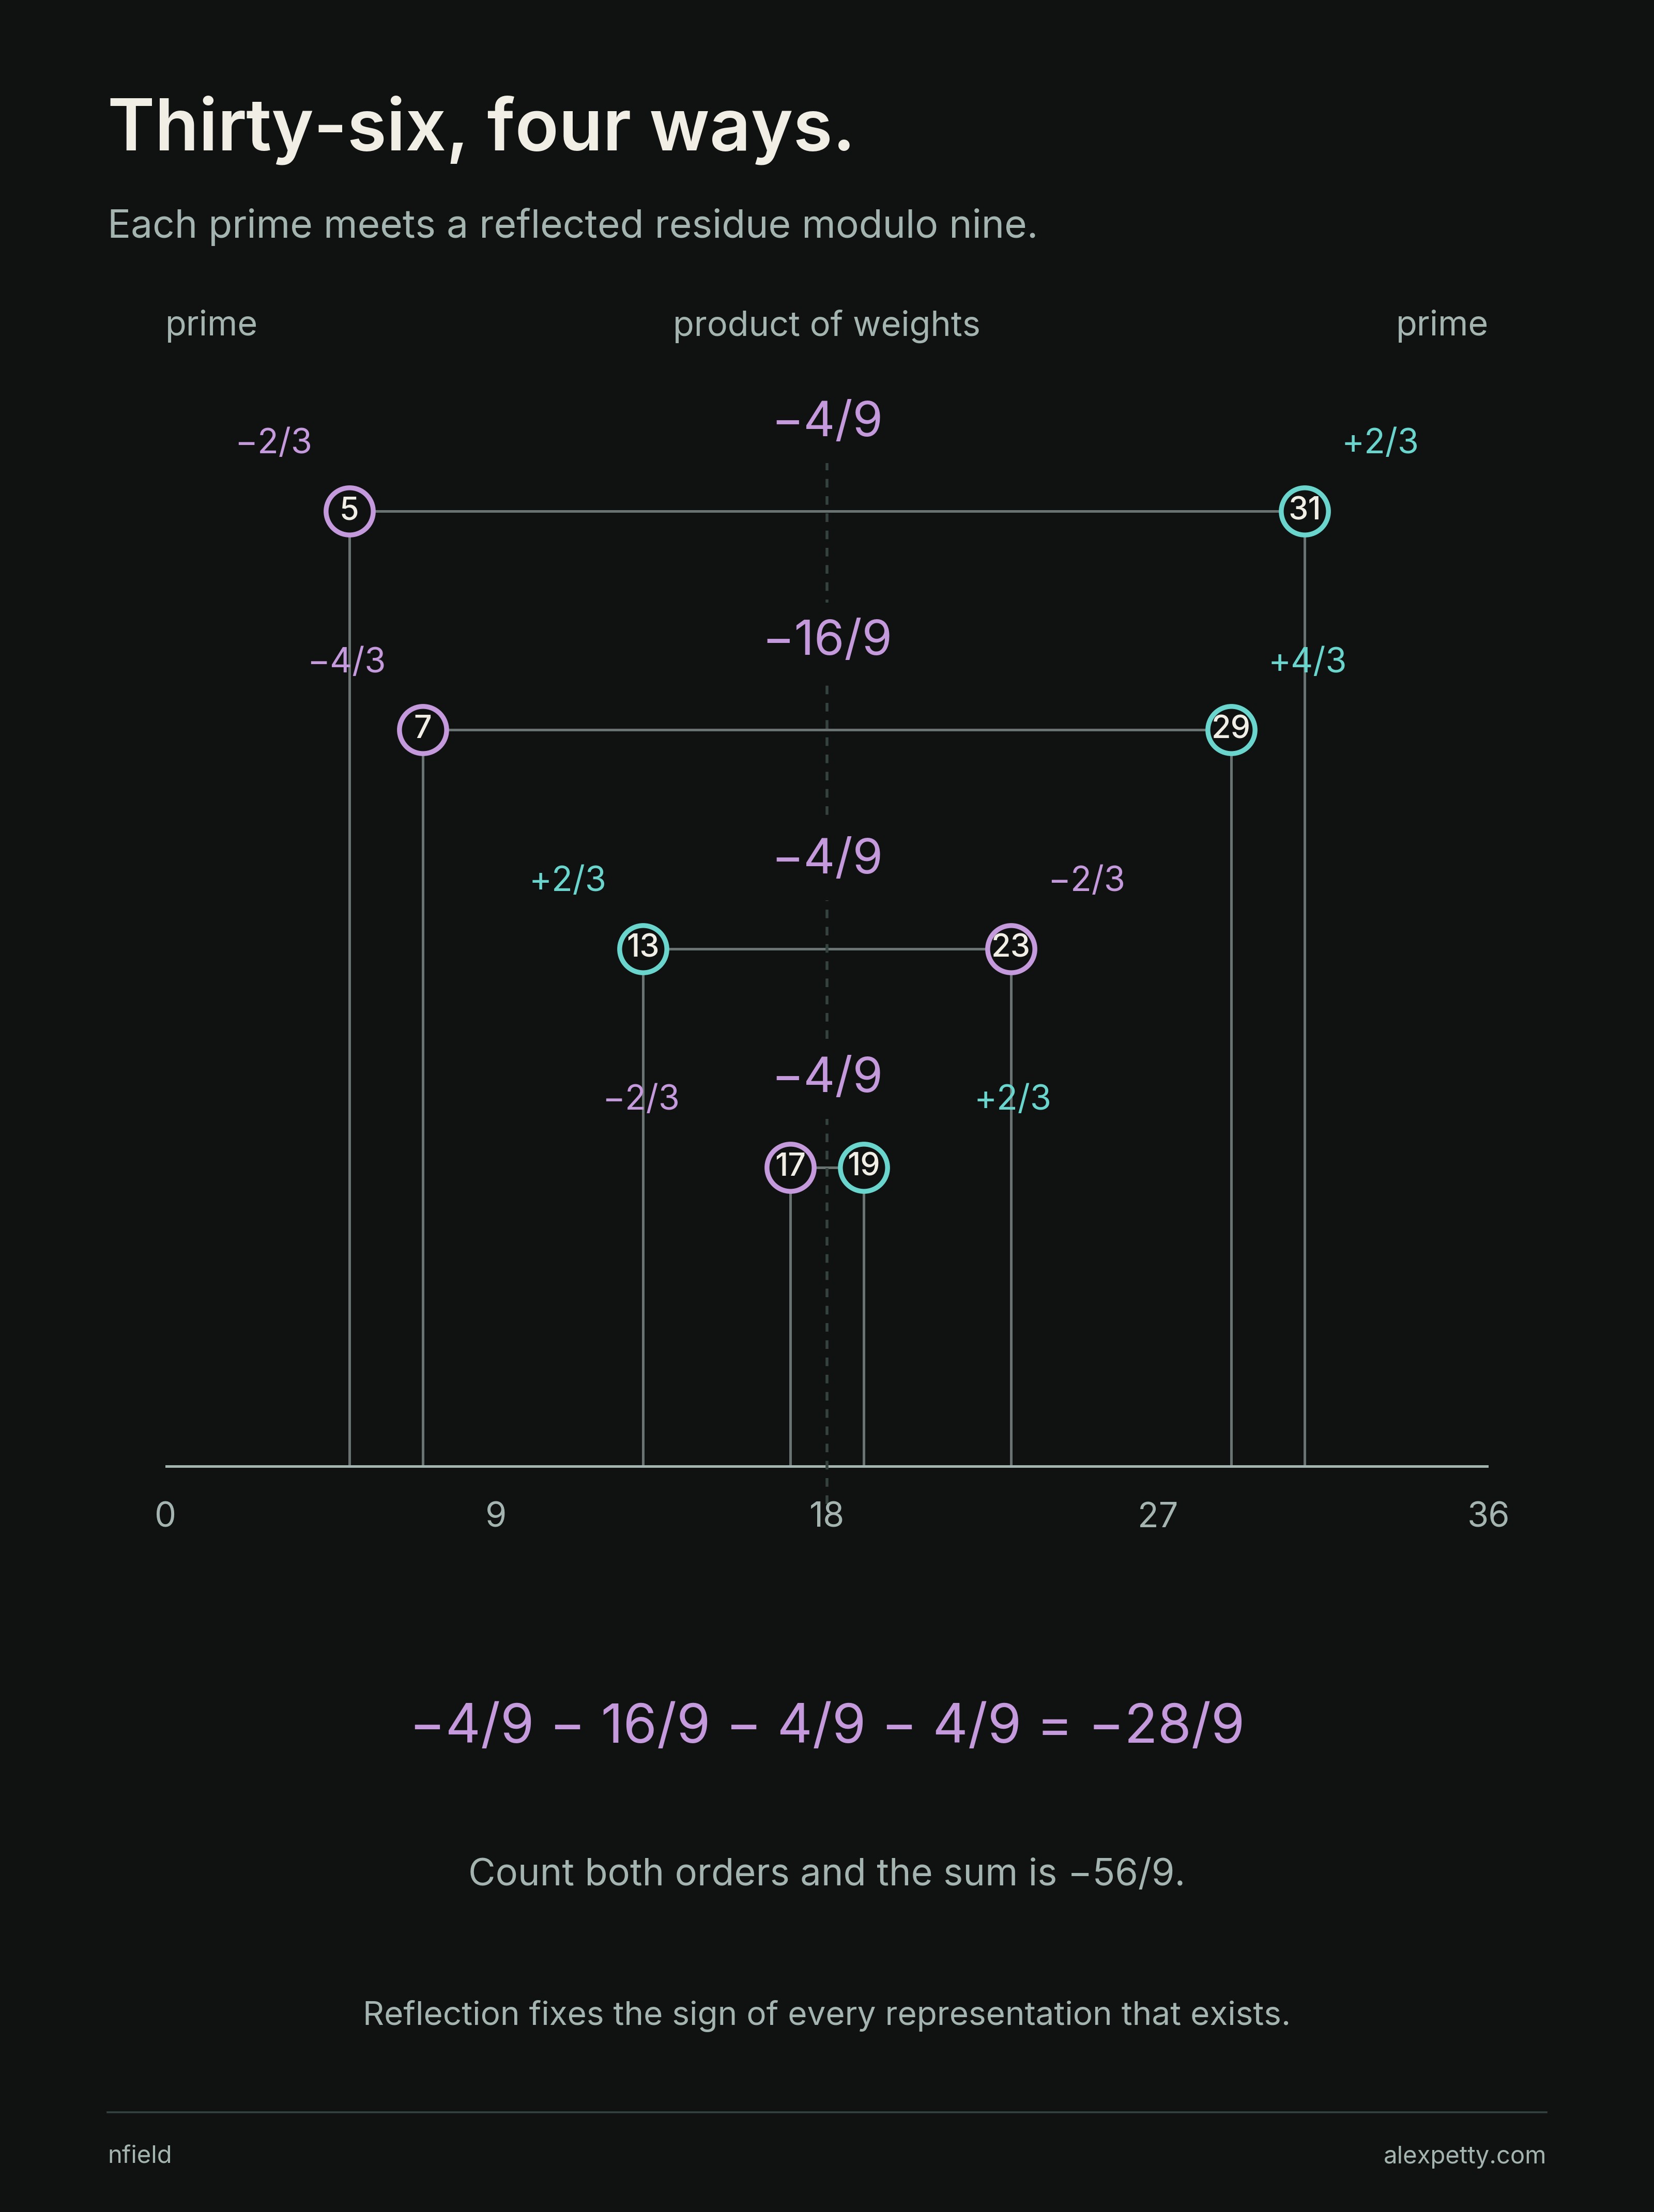
Each pair in the figure faces its partner across , and the two weights always have opposite signs, violet against teal. The products are , , and , for a total of . For any even target divisible by , every pair of primes that adds up to it contributes a product that is zero or negative. The law fixes a sign and is silent on whether such pairs exist.
Back to the four pairs
In the additive grid every negative product has a partner to blame. The multiplicative overlap offers nothing like that. Adding remainders and matching character weights are different operations on the same table, and the sign law does nothing to explain the shortfall.
At base five and a cutoff of two million, pair C holds percent of the prime weight against percent of the collision weight, and the scaled overlap is . Across the six cutoffs the same base reads , , , , and , every one of them under one.
The toy rows, the ten bases and the nine targets as bar charts
Discussion
Sign in to join the discussion.