Boundaries
The Secondary Term of the Cubic Law
Around 1800, Adrien-Marie Legendre studied the tables of primes available to him and proposed a formula for how many primes lie below a number . It was . The odd constant fit his tables beautifully, and it was wrong. Half a century later Pafnuty Chebyshev proved that if any constant belongs in that place, it must be exactly one. Legendre had fitted his constant to the tables, and the primes beyond them didn’t agree.
The first part of that formula, , was right, and it sets the scale. The trouble lived in the correction. That is usually where it lives. A leading term tells you how big something is. The next term tells you how it is built, and it is also where a finite table is most persuasive and least trustworthy.
The digit collisions of a prime base now have a leading term. Their energy grows like the cube of the base, with coefficient exactly one, and the one is proved. This paper goes after the next term. It carries a , which a count of carries has no obvious reason to know about. And before its coefficient can be trusted, it has to survive a hazard Legendre never faced. The digit table does not see a smooth curve. It sees one read at a finite set of evenly spaced points, and readings like that can invent patterns of their own.
Sixteen thirds
The energy is quick to build. In base three, the two-digit words whose digits agree are 00, 11 and 22, sitting at positions zero, four and eight on a wheel of nine. Multiply the wheel by a number sharing no factor with nine, push every mark forward by that same number, and count the marks that pass zero. Compare the count with the share the size of the step would predict. Square the difference for each of the six allowed multipliers, and add.
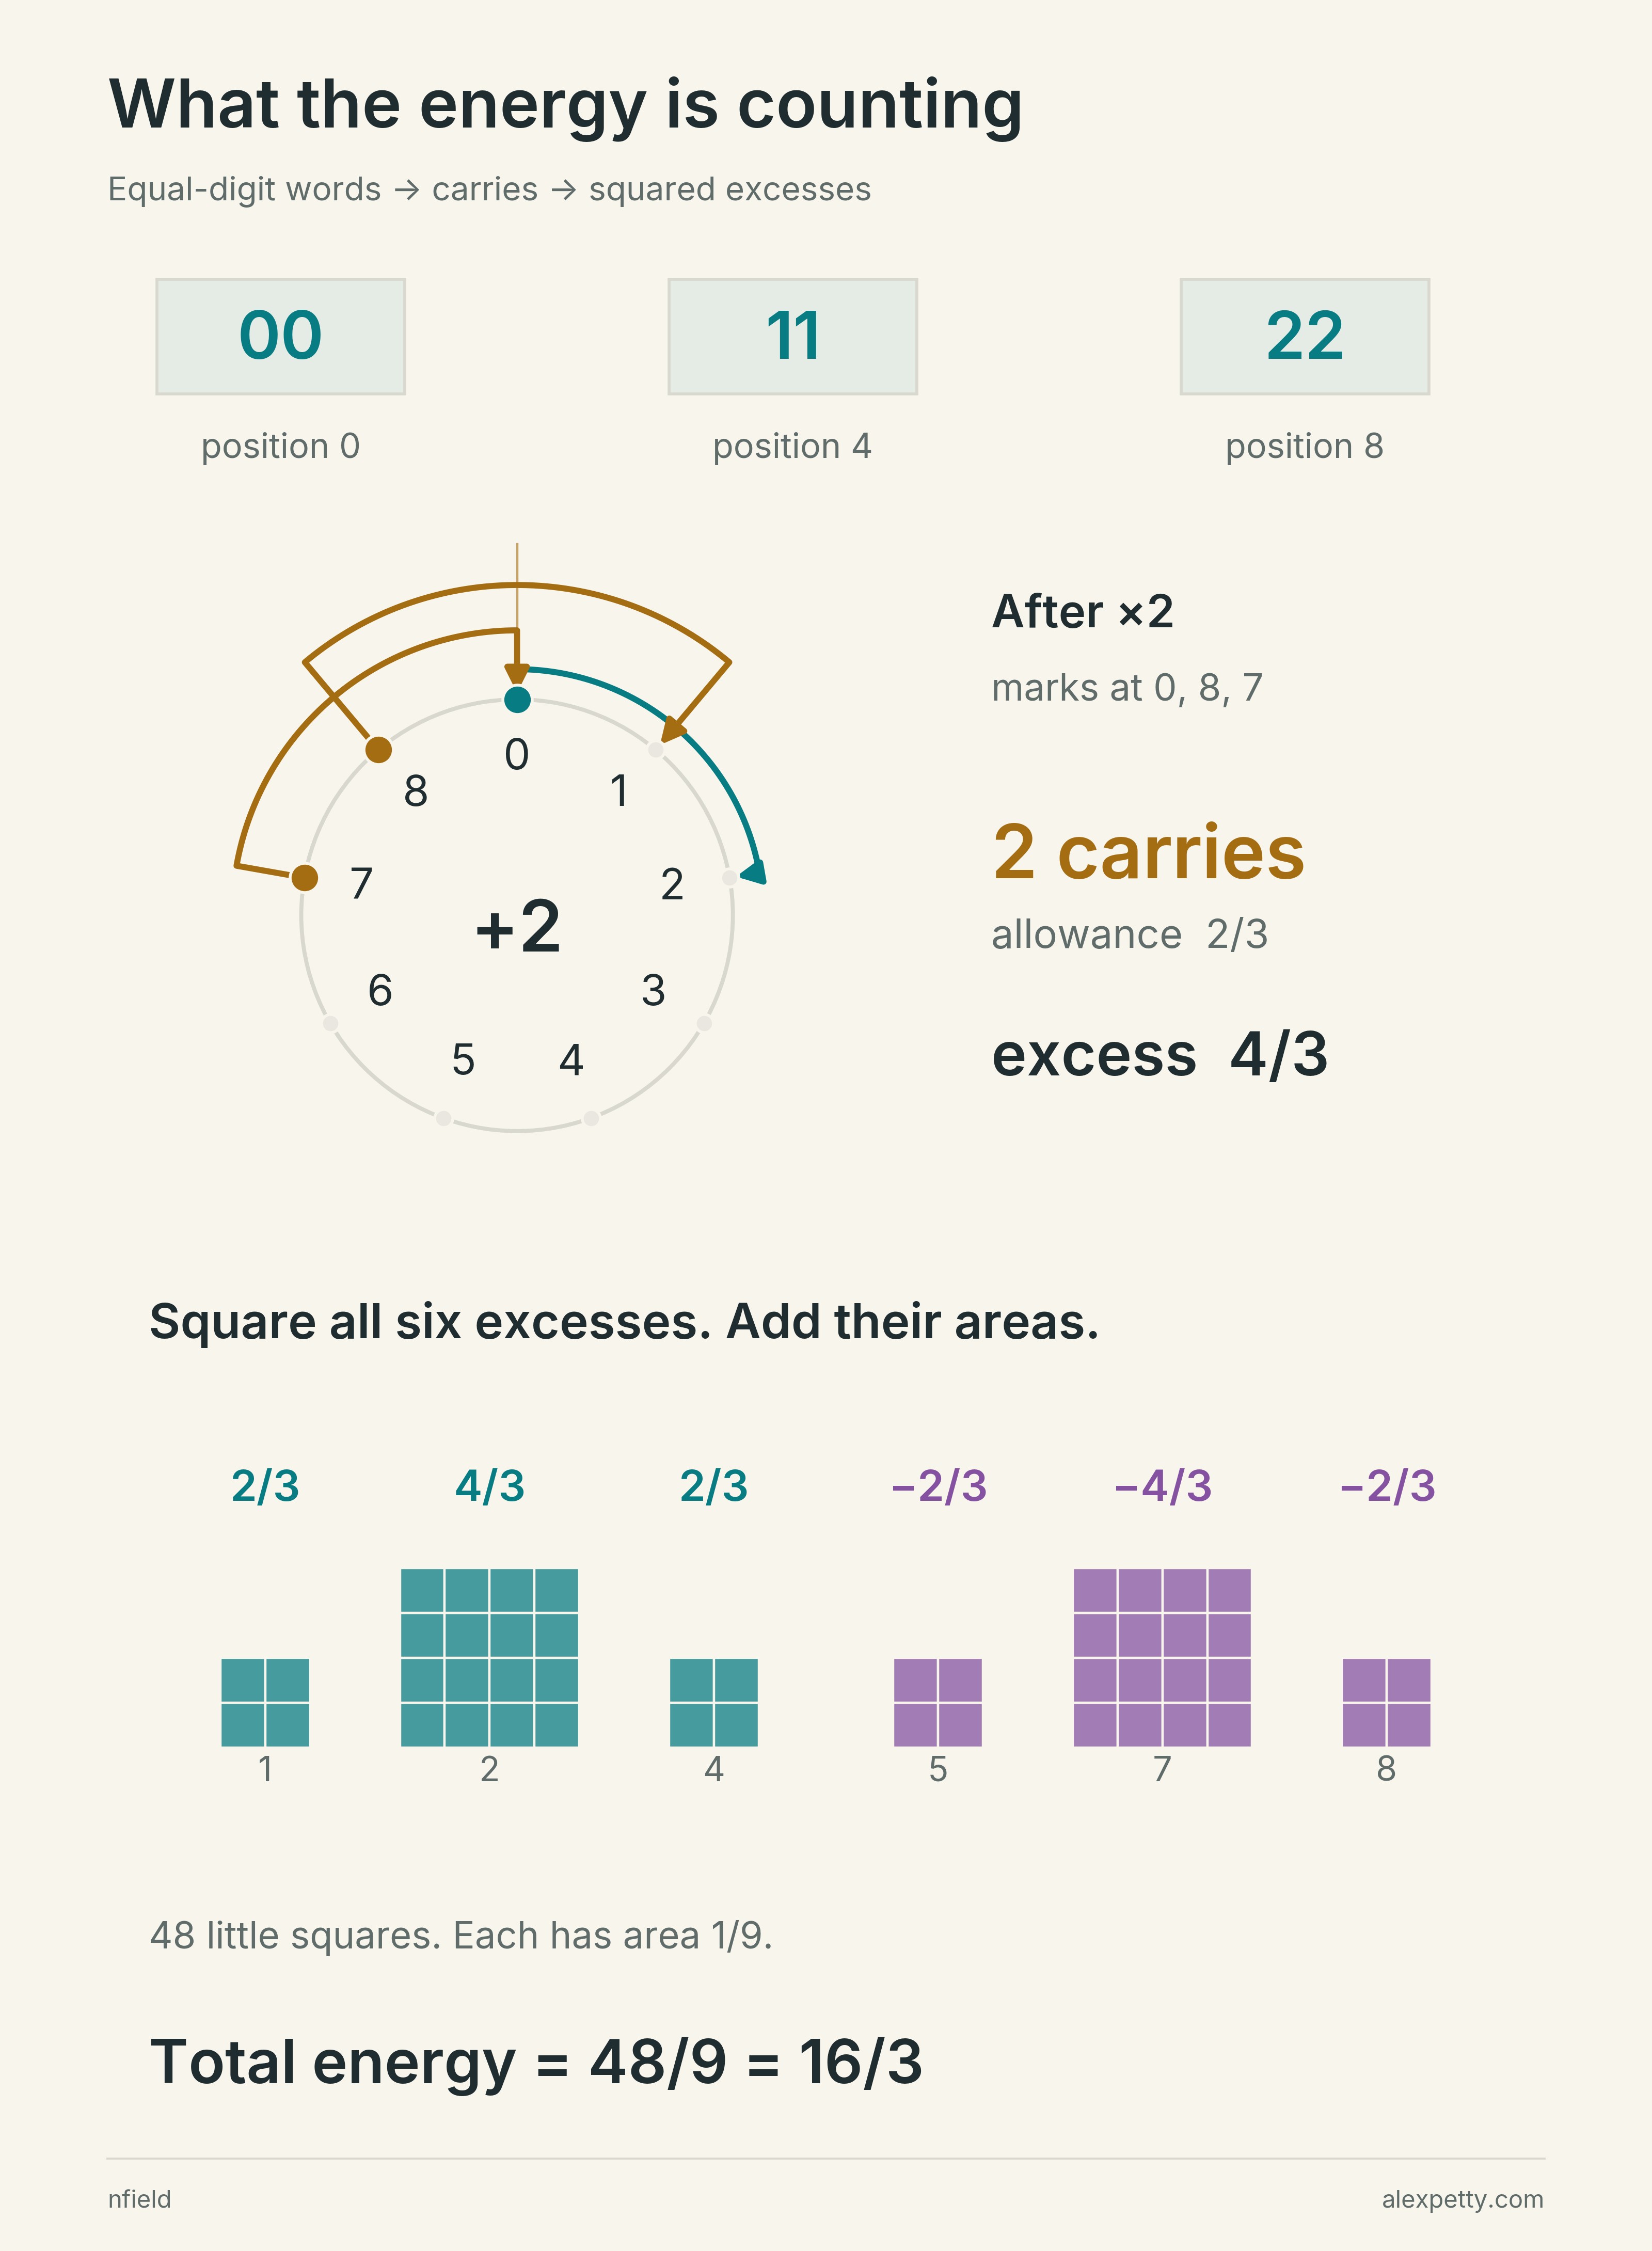
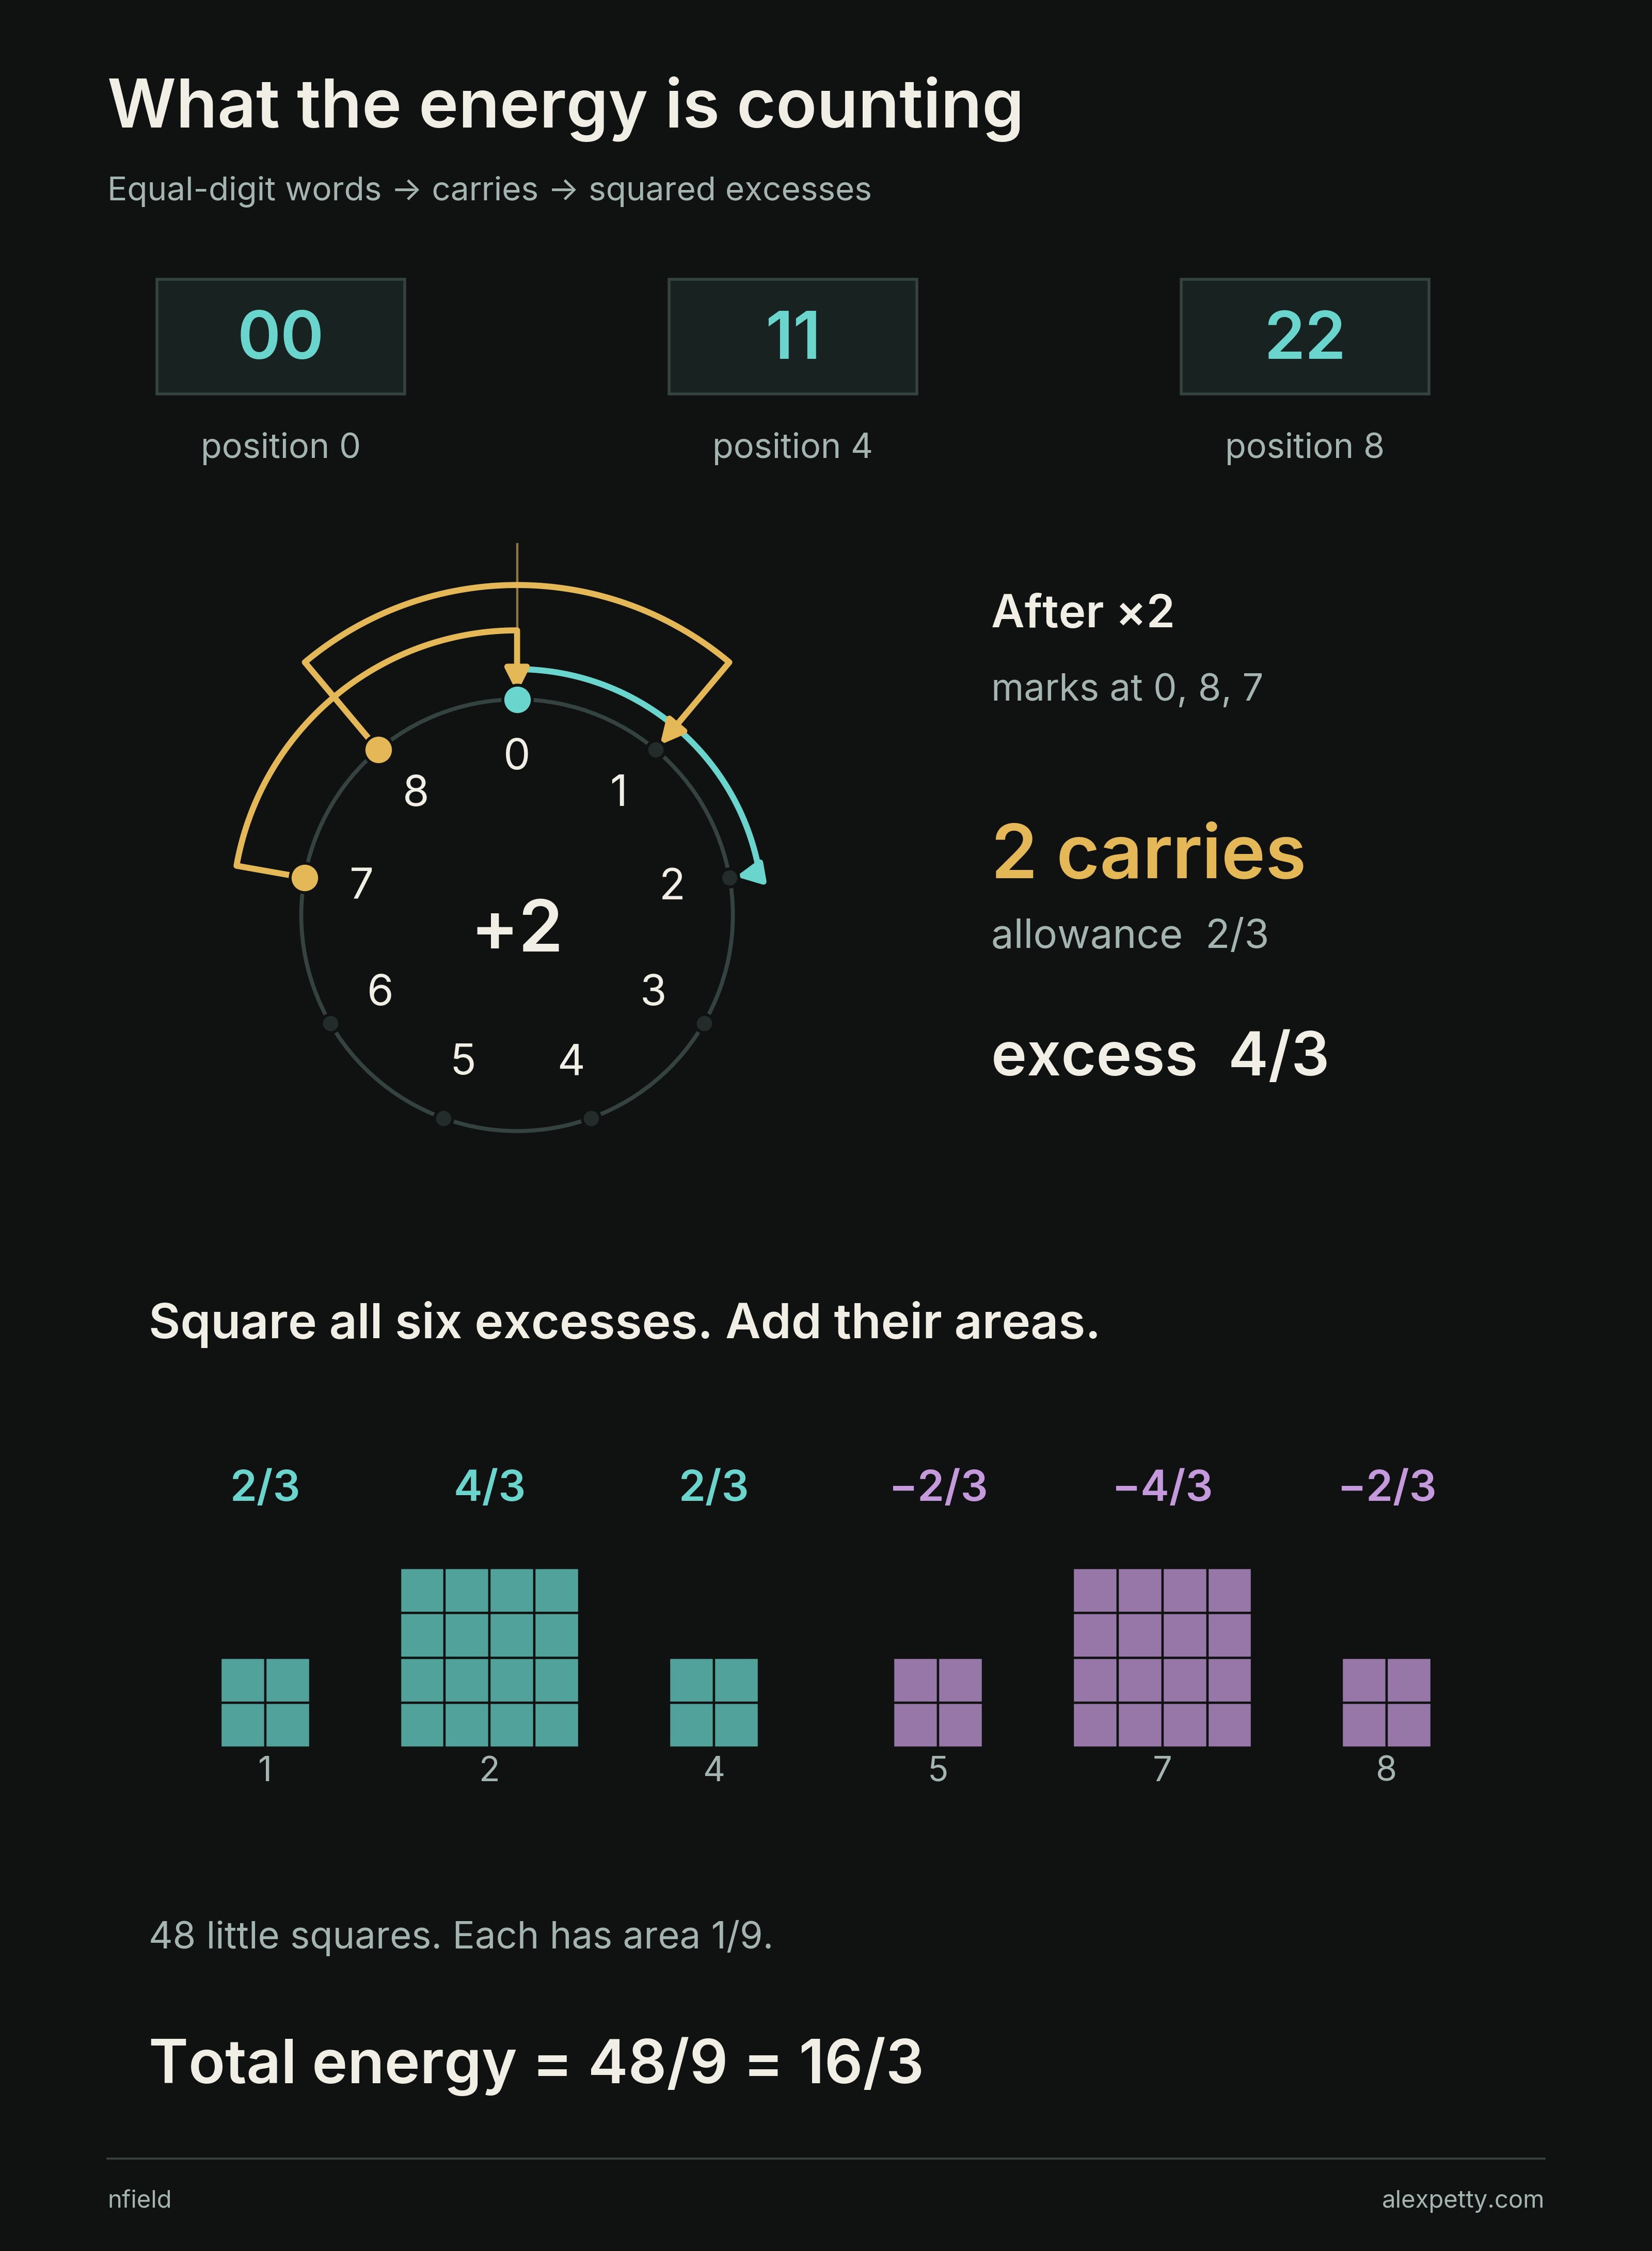
The six squares come to sixteen thirds. For a prime base the same recipe runs over every position modulo , and the total is written .
All six counts, with the exact definition
For an odd prime base , the matching-digit positions are modulo , for . At multiplier , let count the marks that cross the join after the further step of . The proportional allowance is . Thus
This is the paper’s class-centering, simplified. It assumes no random-digit model. At multiples of the centered response is zero, so including those positions does not change the energy.
| Multiplier | Carries | Allowance | Excess |
|---|---|---|---|
| 1 | 1 | 1/3 | 2/3 |
| 2 | 2 | 2/3 | 4/3 |
| 4 | 2 | 4/3 | 2/3 |
| 5 | 1 | 5/3 | -2/3 |
| 7 | 1 | 7/3 | -4/3 |
| 8 | 2 | 8/3 | -2/3 |
The squared numerators are , all over nine. Their sum is .
Missing by a billion
The law proved in Digit Collisions and the Cubic Law says that divided by tends to one. Measure the gap two ways, as a share of the cube and as a plain number, and the two measurements disagree about which way things are going.
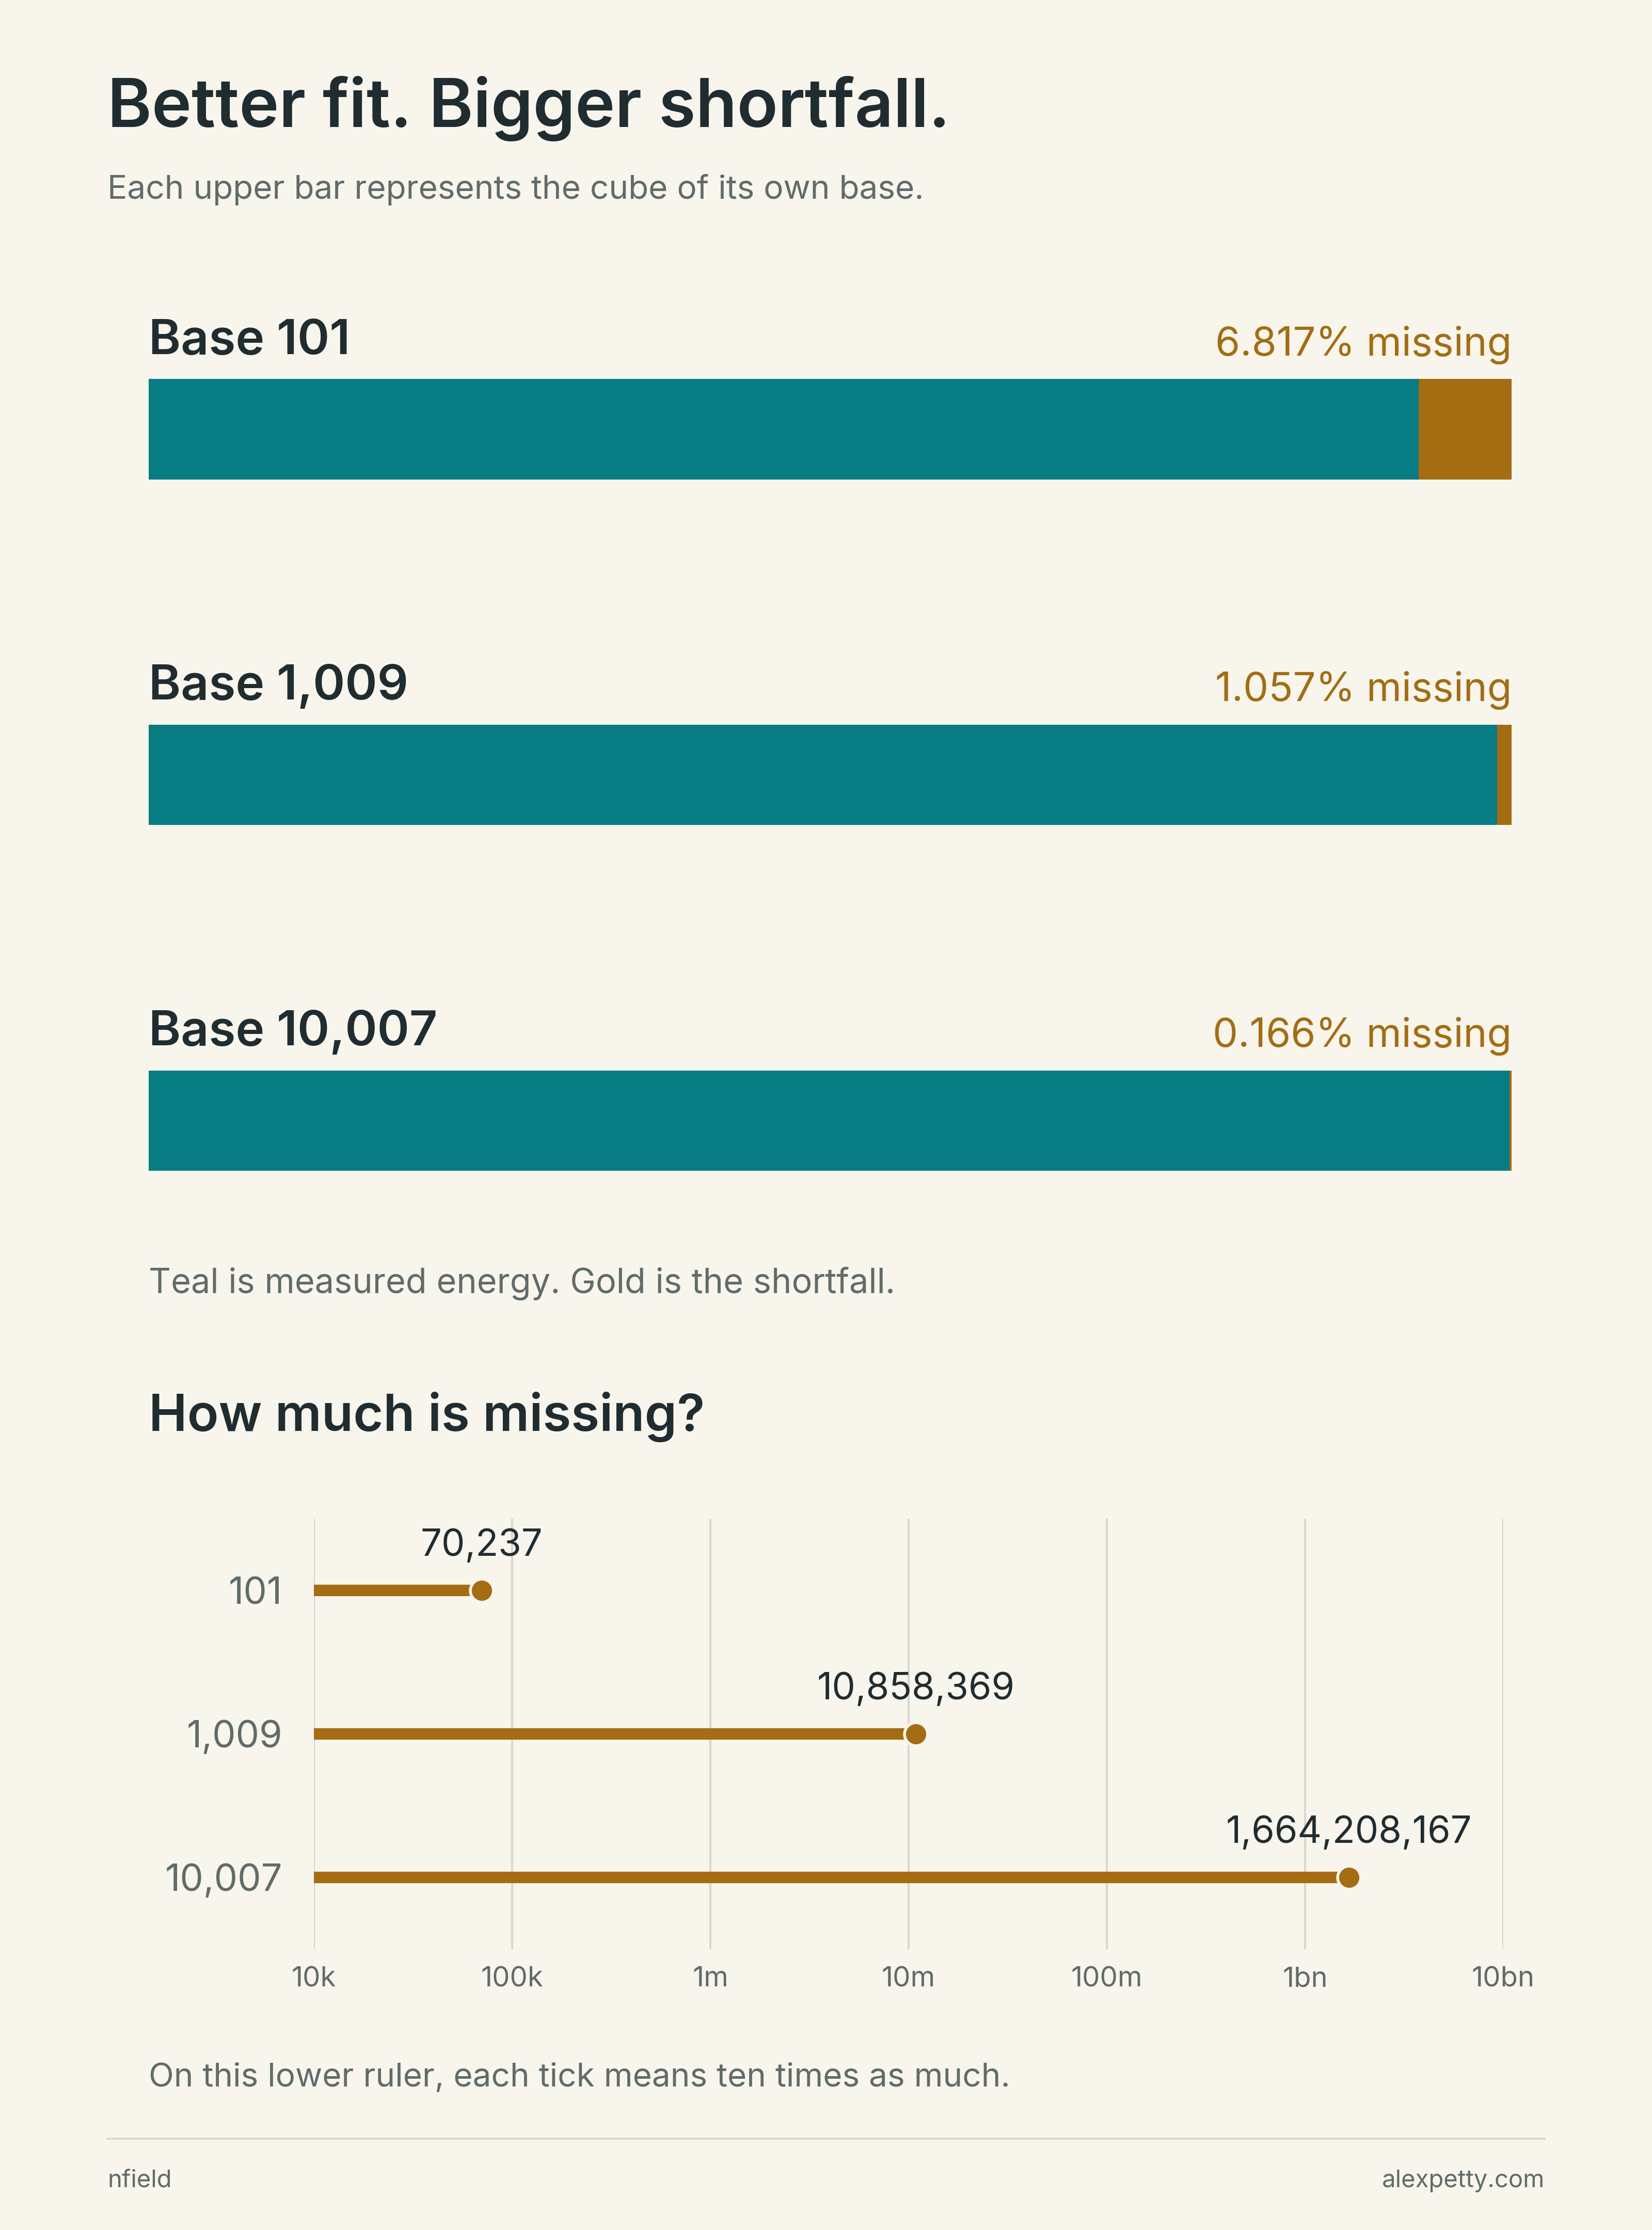
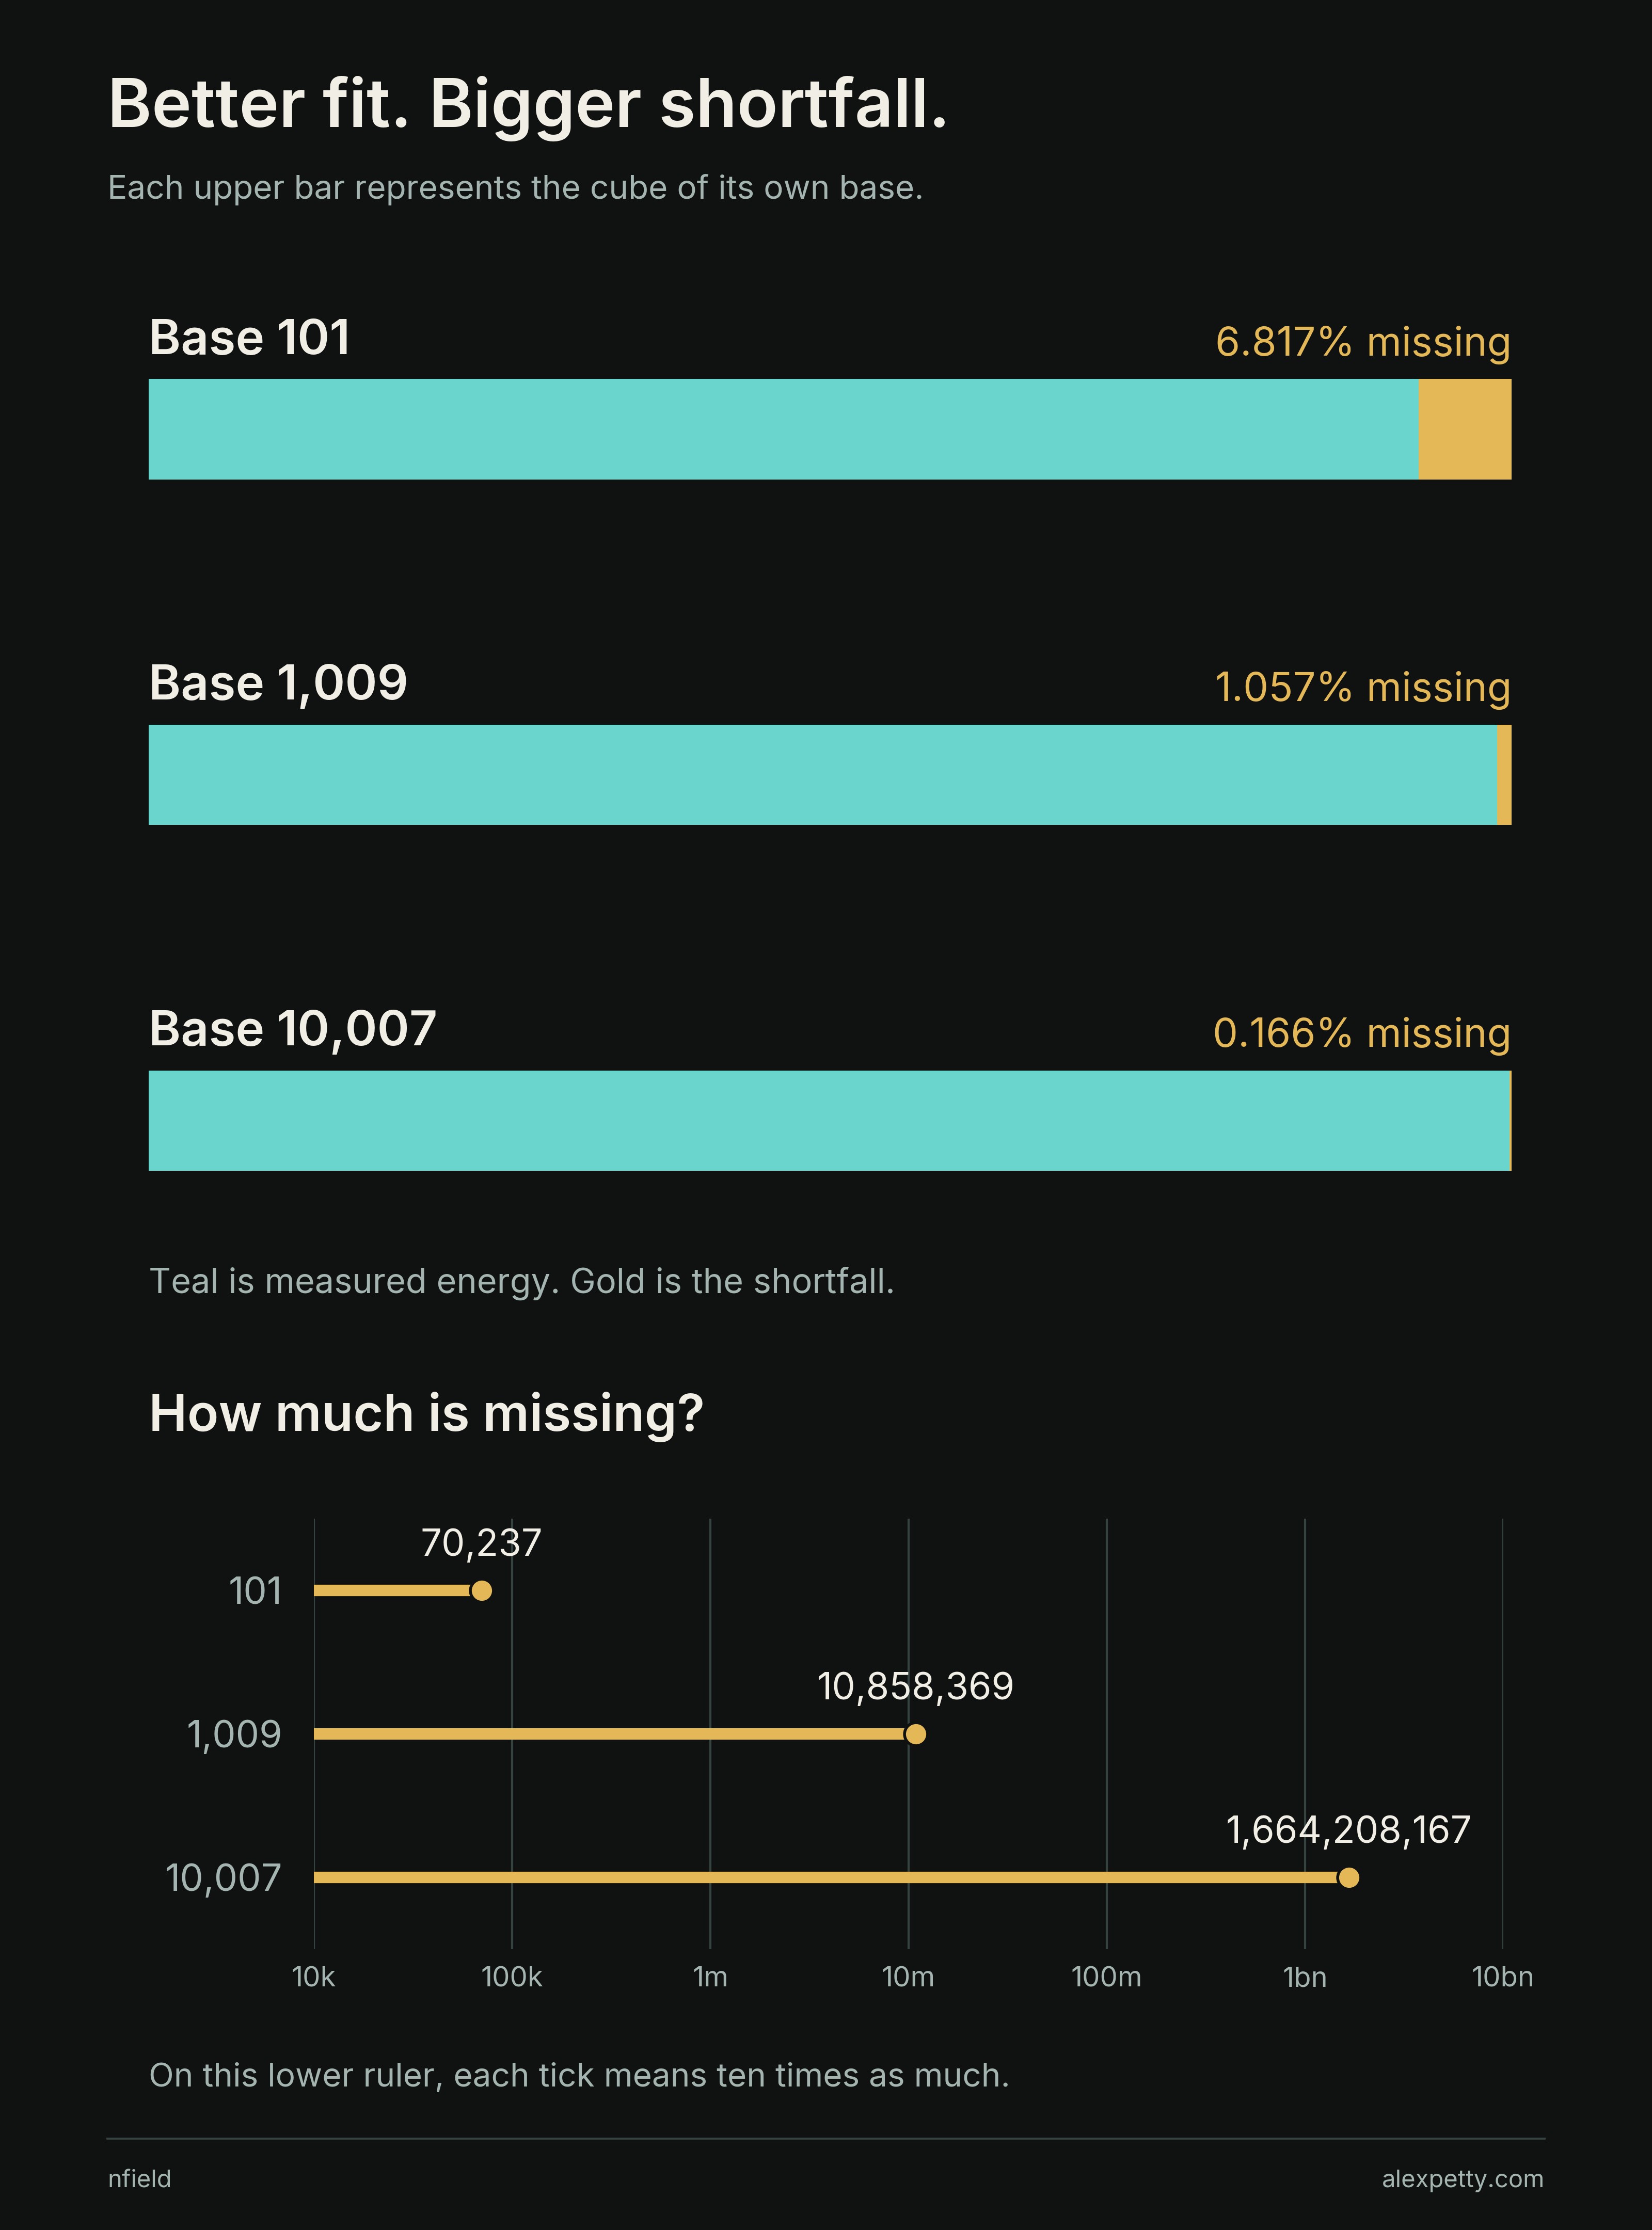
At base 101 the energy falls short of the cube by 70,237, almost seven percent. At base 10,007 it falls short by 1,664,208,167, about one sixth of one percent. Across the three bars the gold sliver all but vanishes, while the dots on the lower ruler march right. The percentage shrinks while the amount grows, and the second term is the law that reconciles the two. The cube is right. The question now is how much it misses, and at what rate.
A third of a copy
The shortfall is made of something very plain, fractions of things that cannot be split.
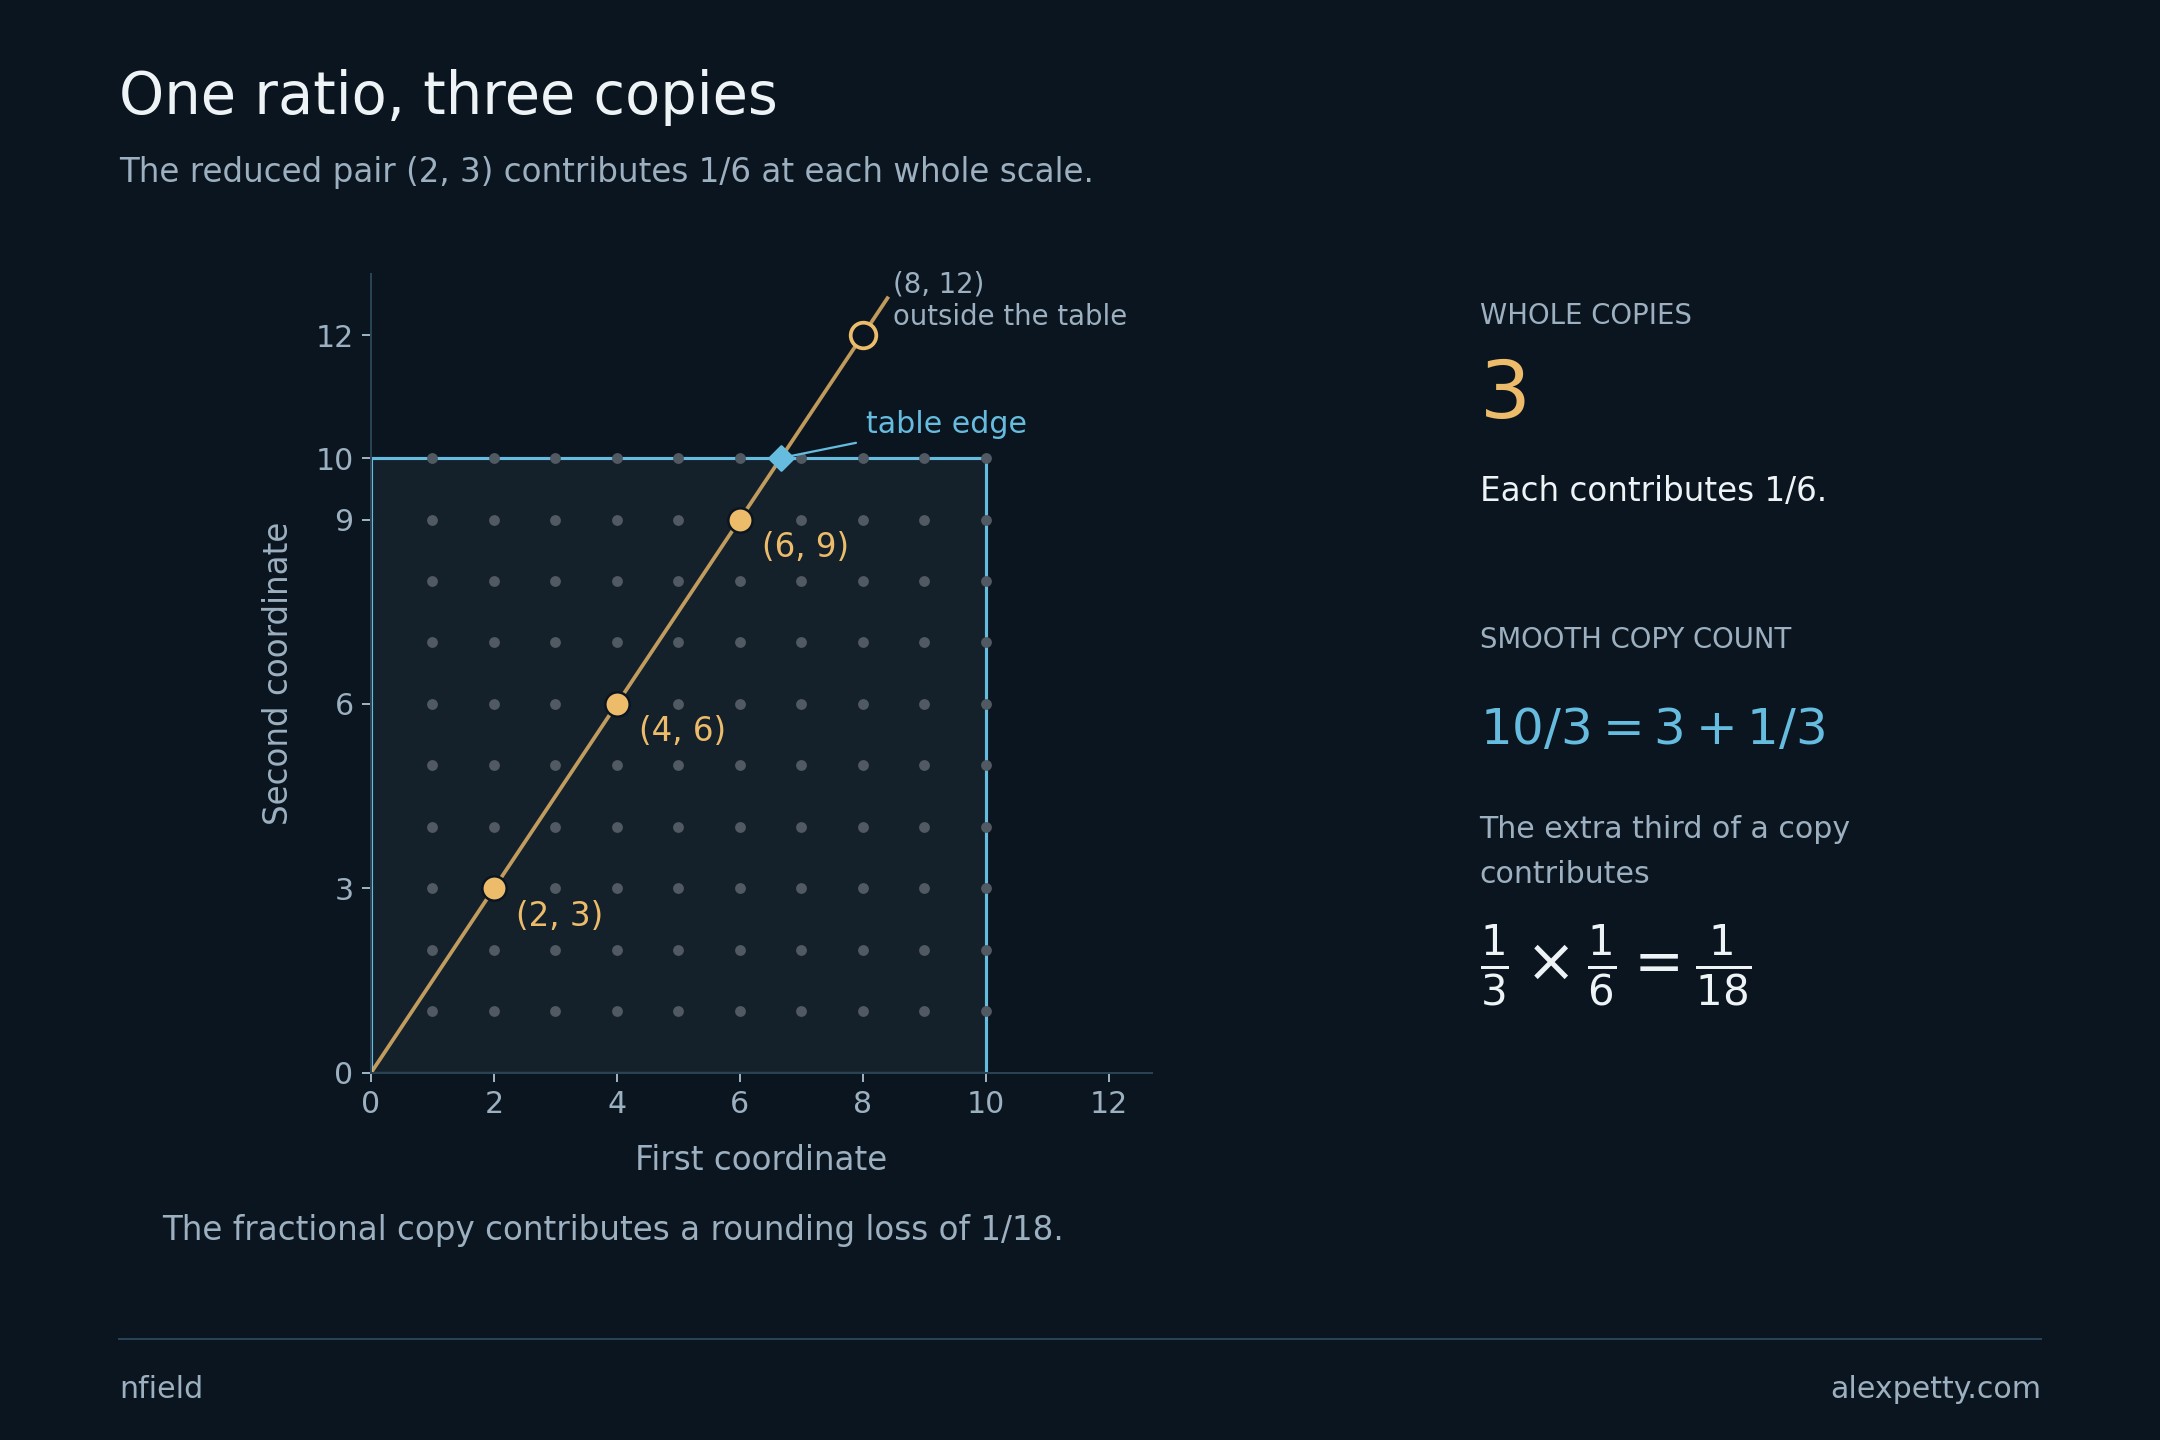
Squaring a sum sets its pieces against each other in pairs, and after the first reduction in the proof those pairs live in a table with a simple rule. Take two whole numbers and divide their greatest common divisor by their least common multiple. That is the weight of their cell. The pair (2, 3) has greatest common divisor one and least common multiple six, so it weighs one sixth. So does (4, 6), and so does (6, 9). Scaling both numbers by the same factor changes nothing.
Now give the table a width of ten. Three copies of (2, 3) fit. The fourth, at (8, 12), does not. A smooth calculation divides ten by three and allows three and a third copies. The table can hold only three. The missing third of a copy, at one sixth apiece, is one eighteenth.
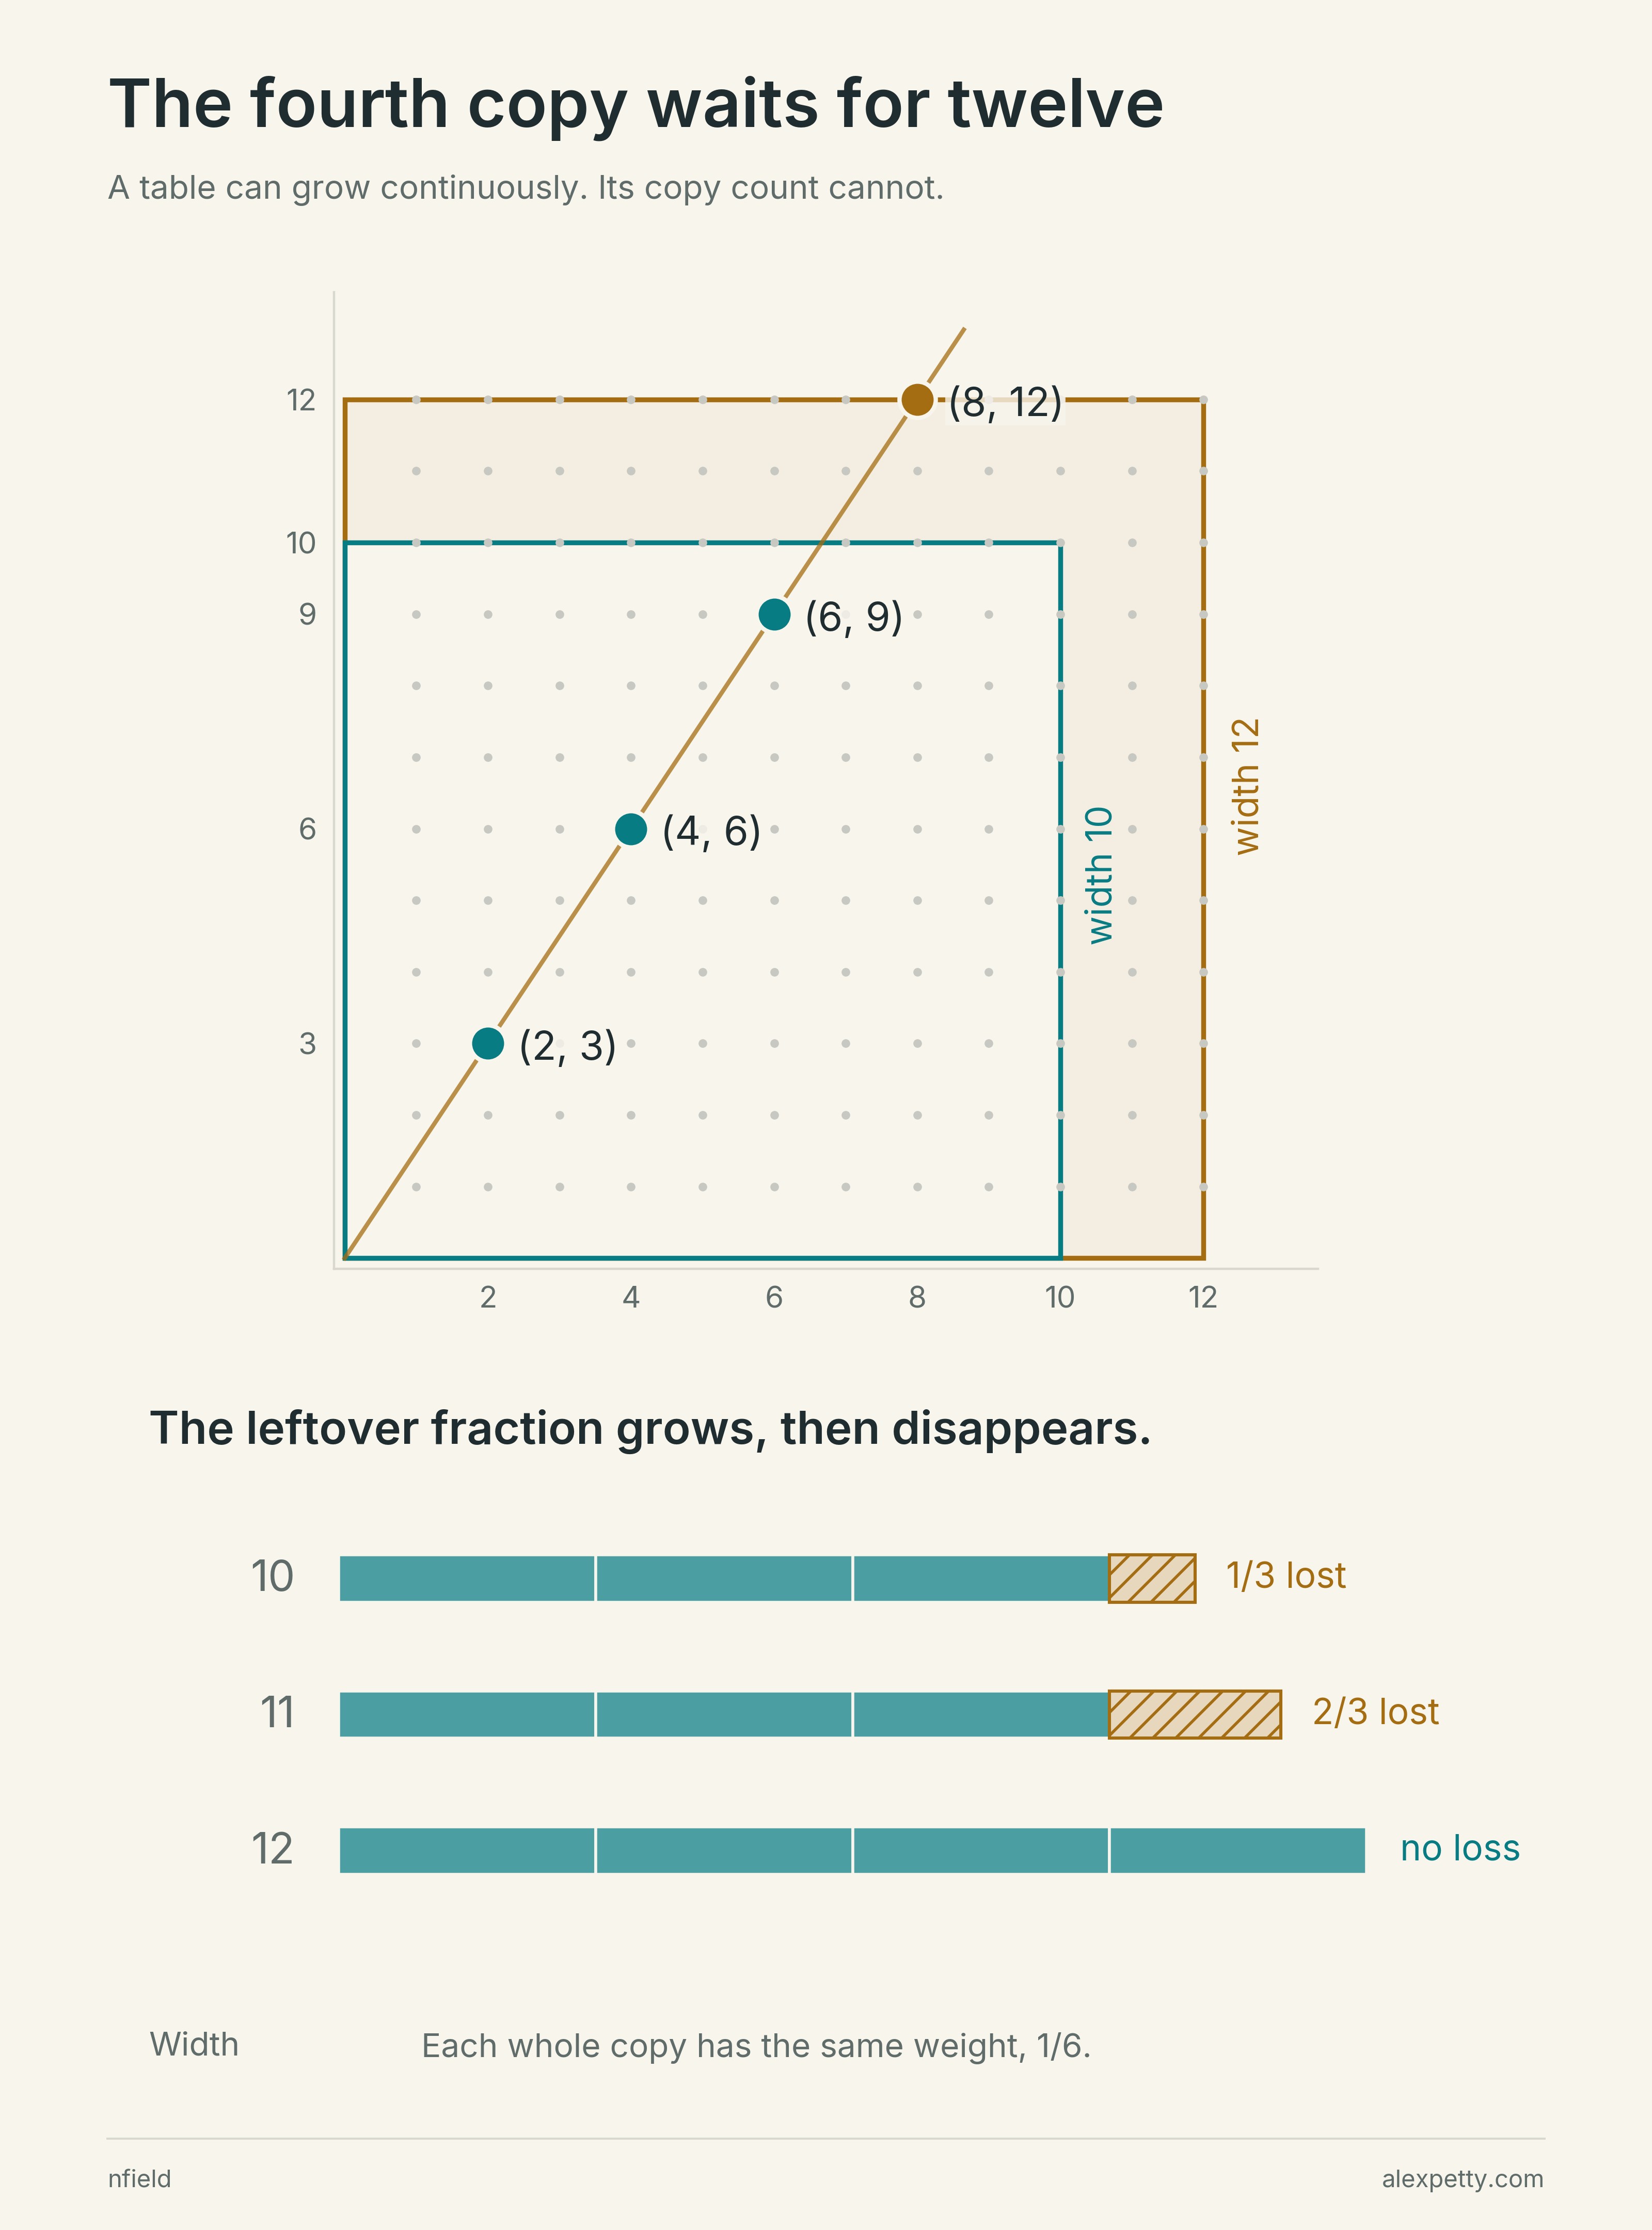
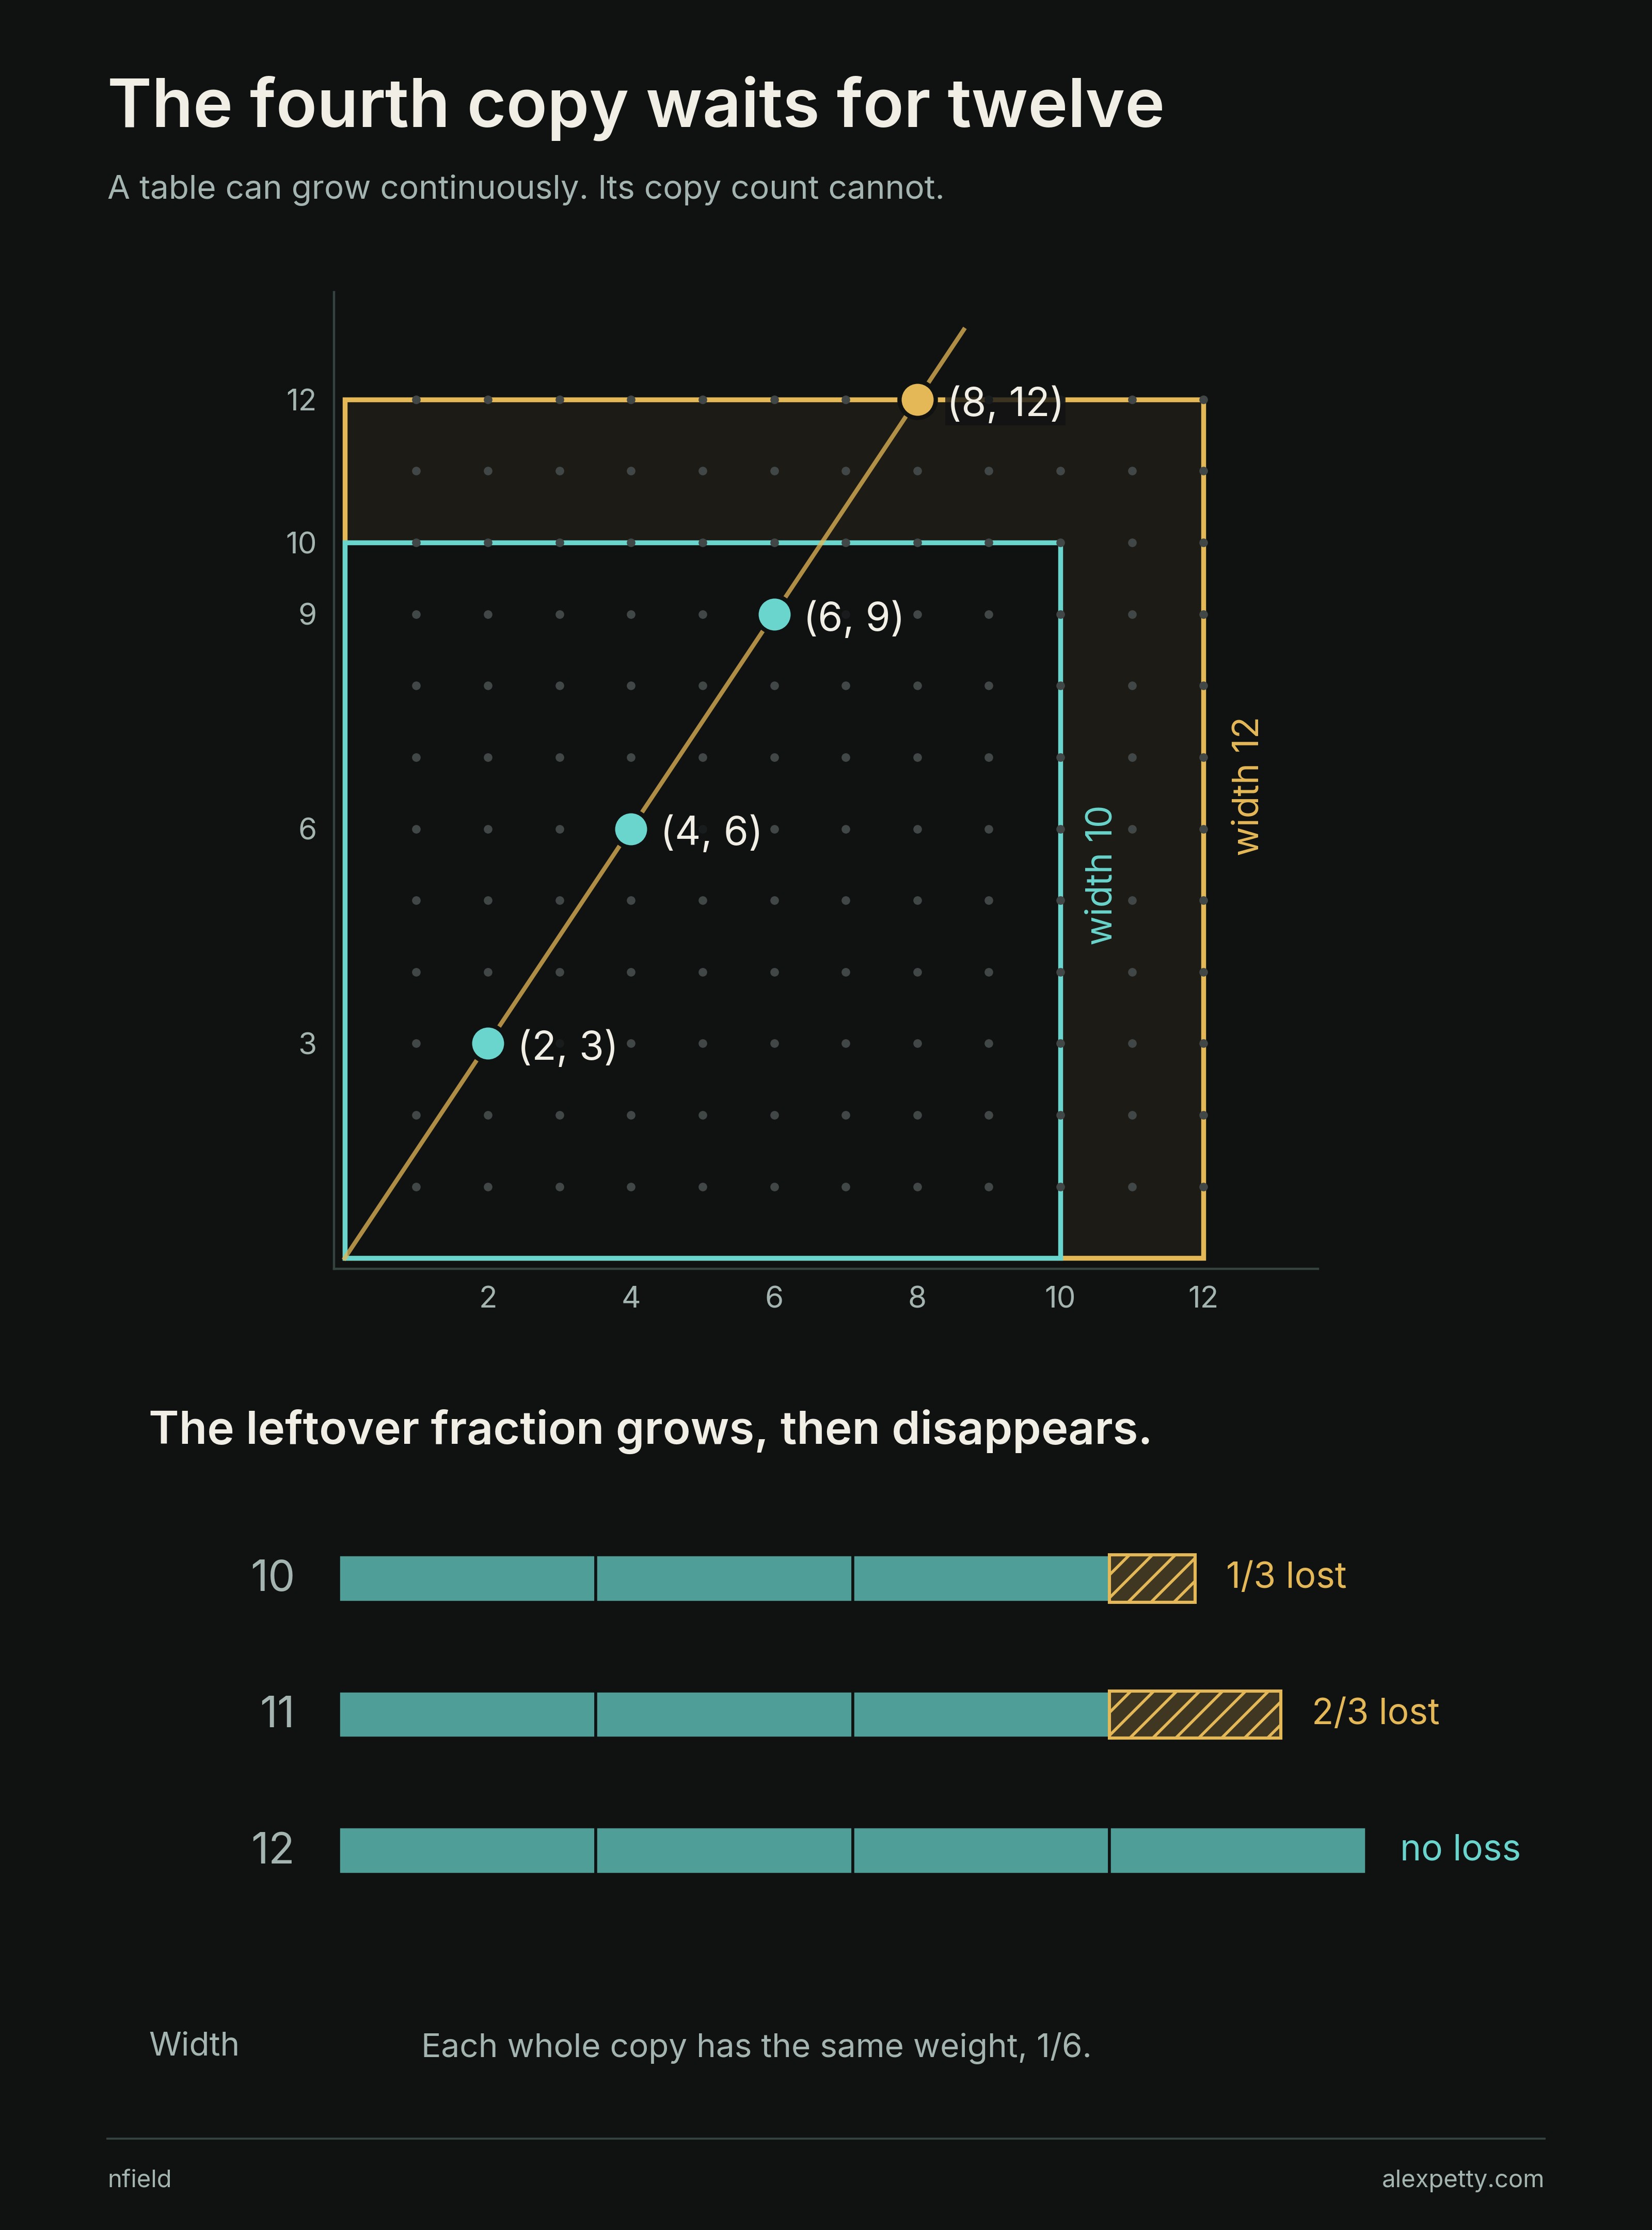
Every reduced pair has its own count of copies and its own lost fraction. A pair whose larger number divides the width loses nothing. The rest round down, and pairs too large to fit even once lose a little more. Add up every one of those slivers and you have the second term.
Two logarithms and a pi
The slivers get lighter as the pairs get larger. Their weights fall off like one, one half, one third and so on, and a sum like that does not grow in proportion to its length. It grows like a logarithm. The pair table runs that slow sum twice, once along the smaller coordinate and once along the larger, so the loss collects two logarithms. On average each lost fraction is half a copy. That sounds obvious, but the fractions come from dividing one number by many others, and it takes a theorem of Saffari and Vaughan to justify it.
Then the . Pick two whole numbers at random. The chance that they share no common factor is , about sixty-one percent, as Dirichlet already knew in 1849. Only reduced pairs lose slivers, because every other cell is a scaled copy of one, so the entire loss is filtered through that same proportion. The comes in through a side door marked no common factor, and it brings no circle with it.
Look more closely at the pairs
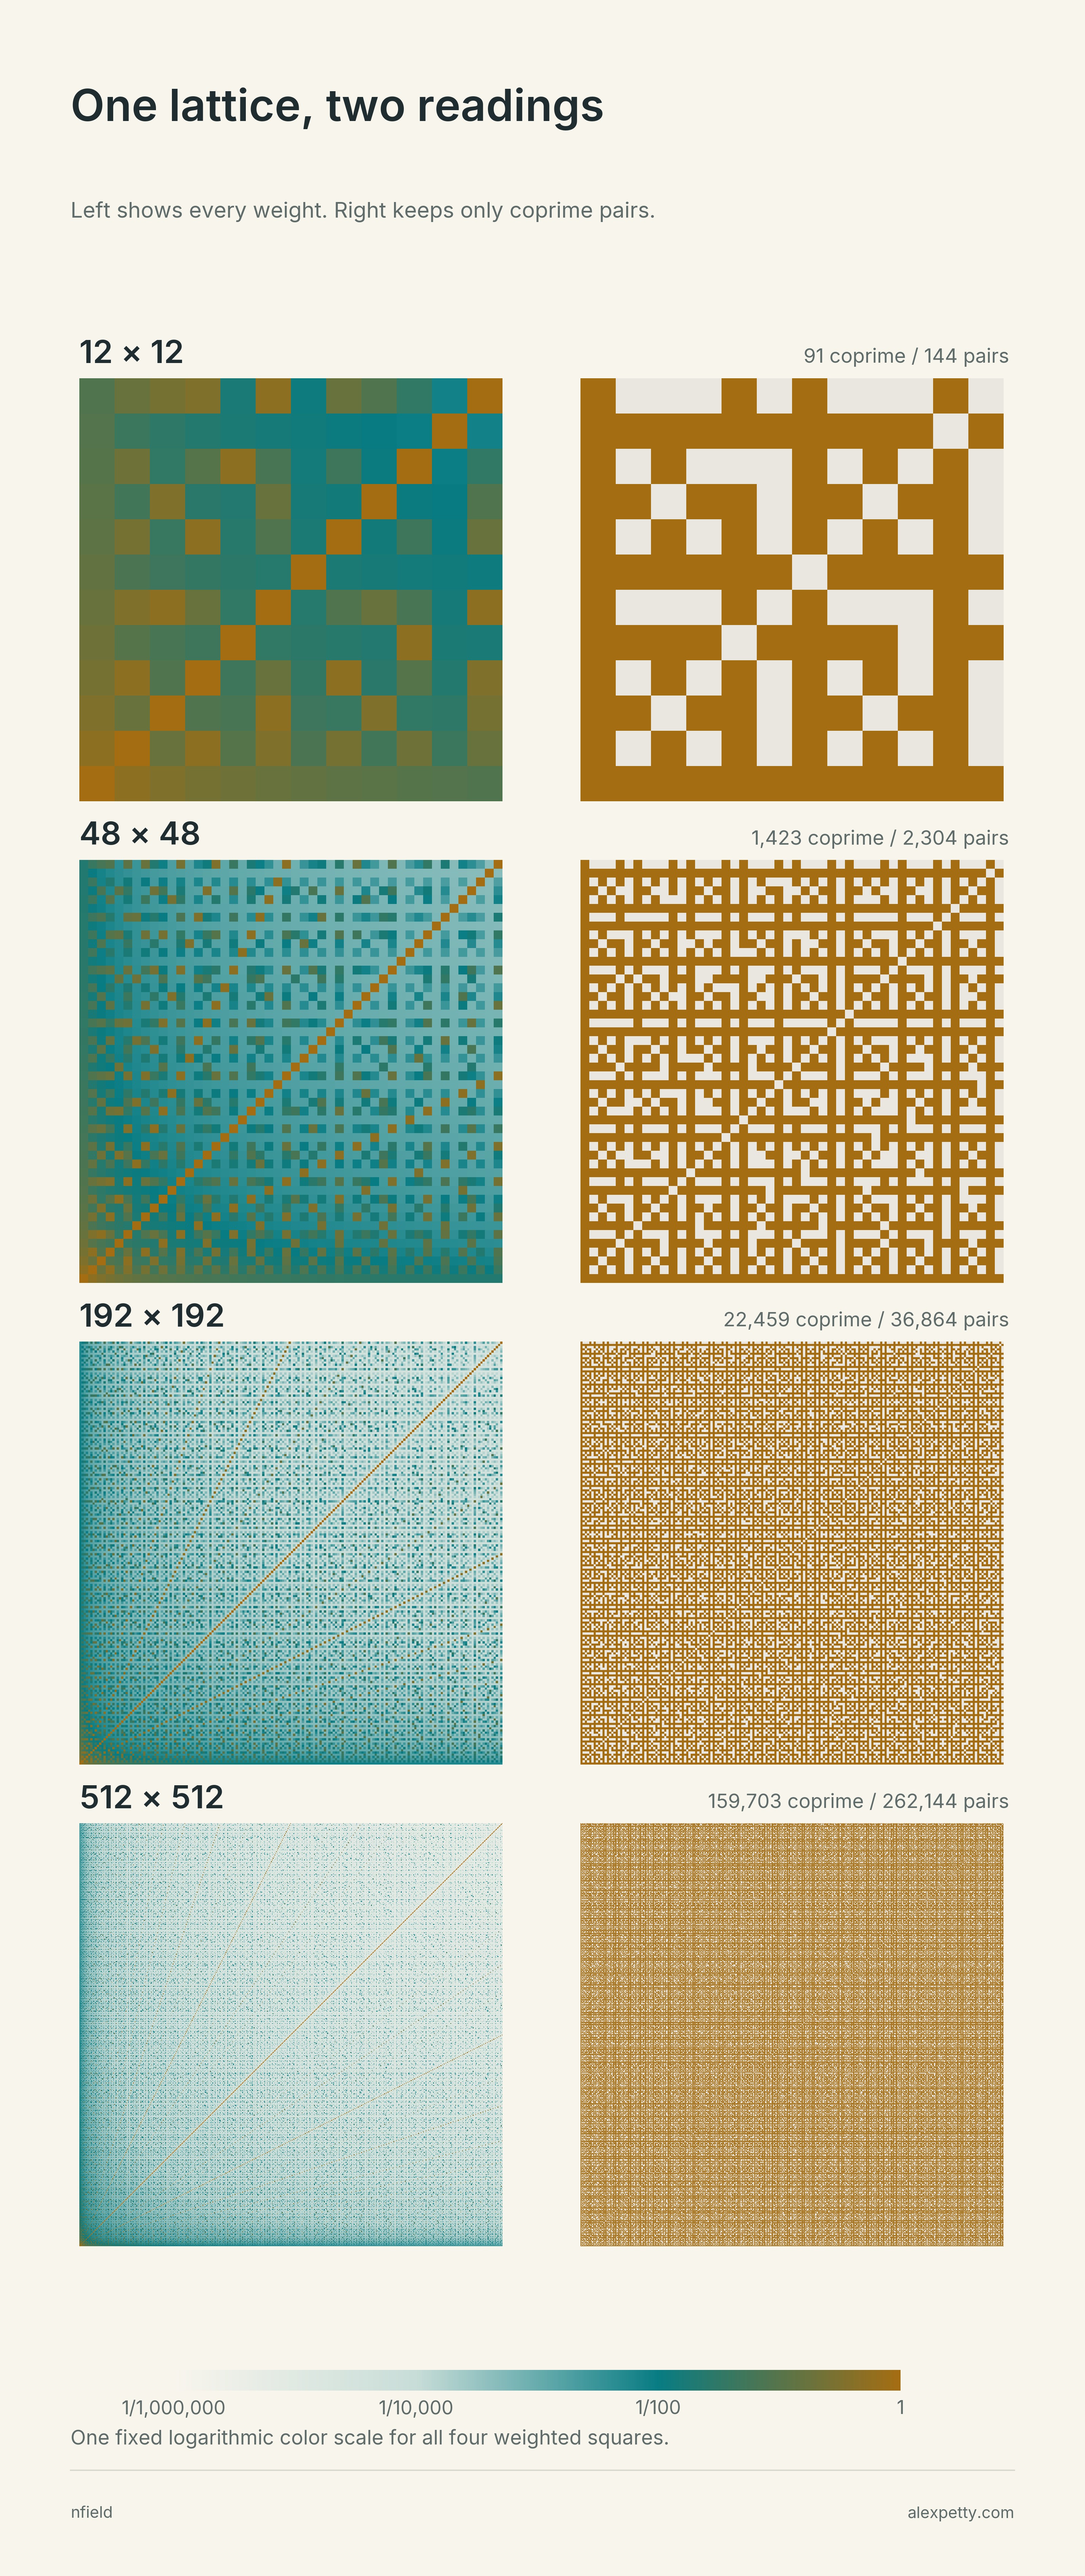
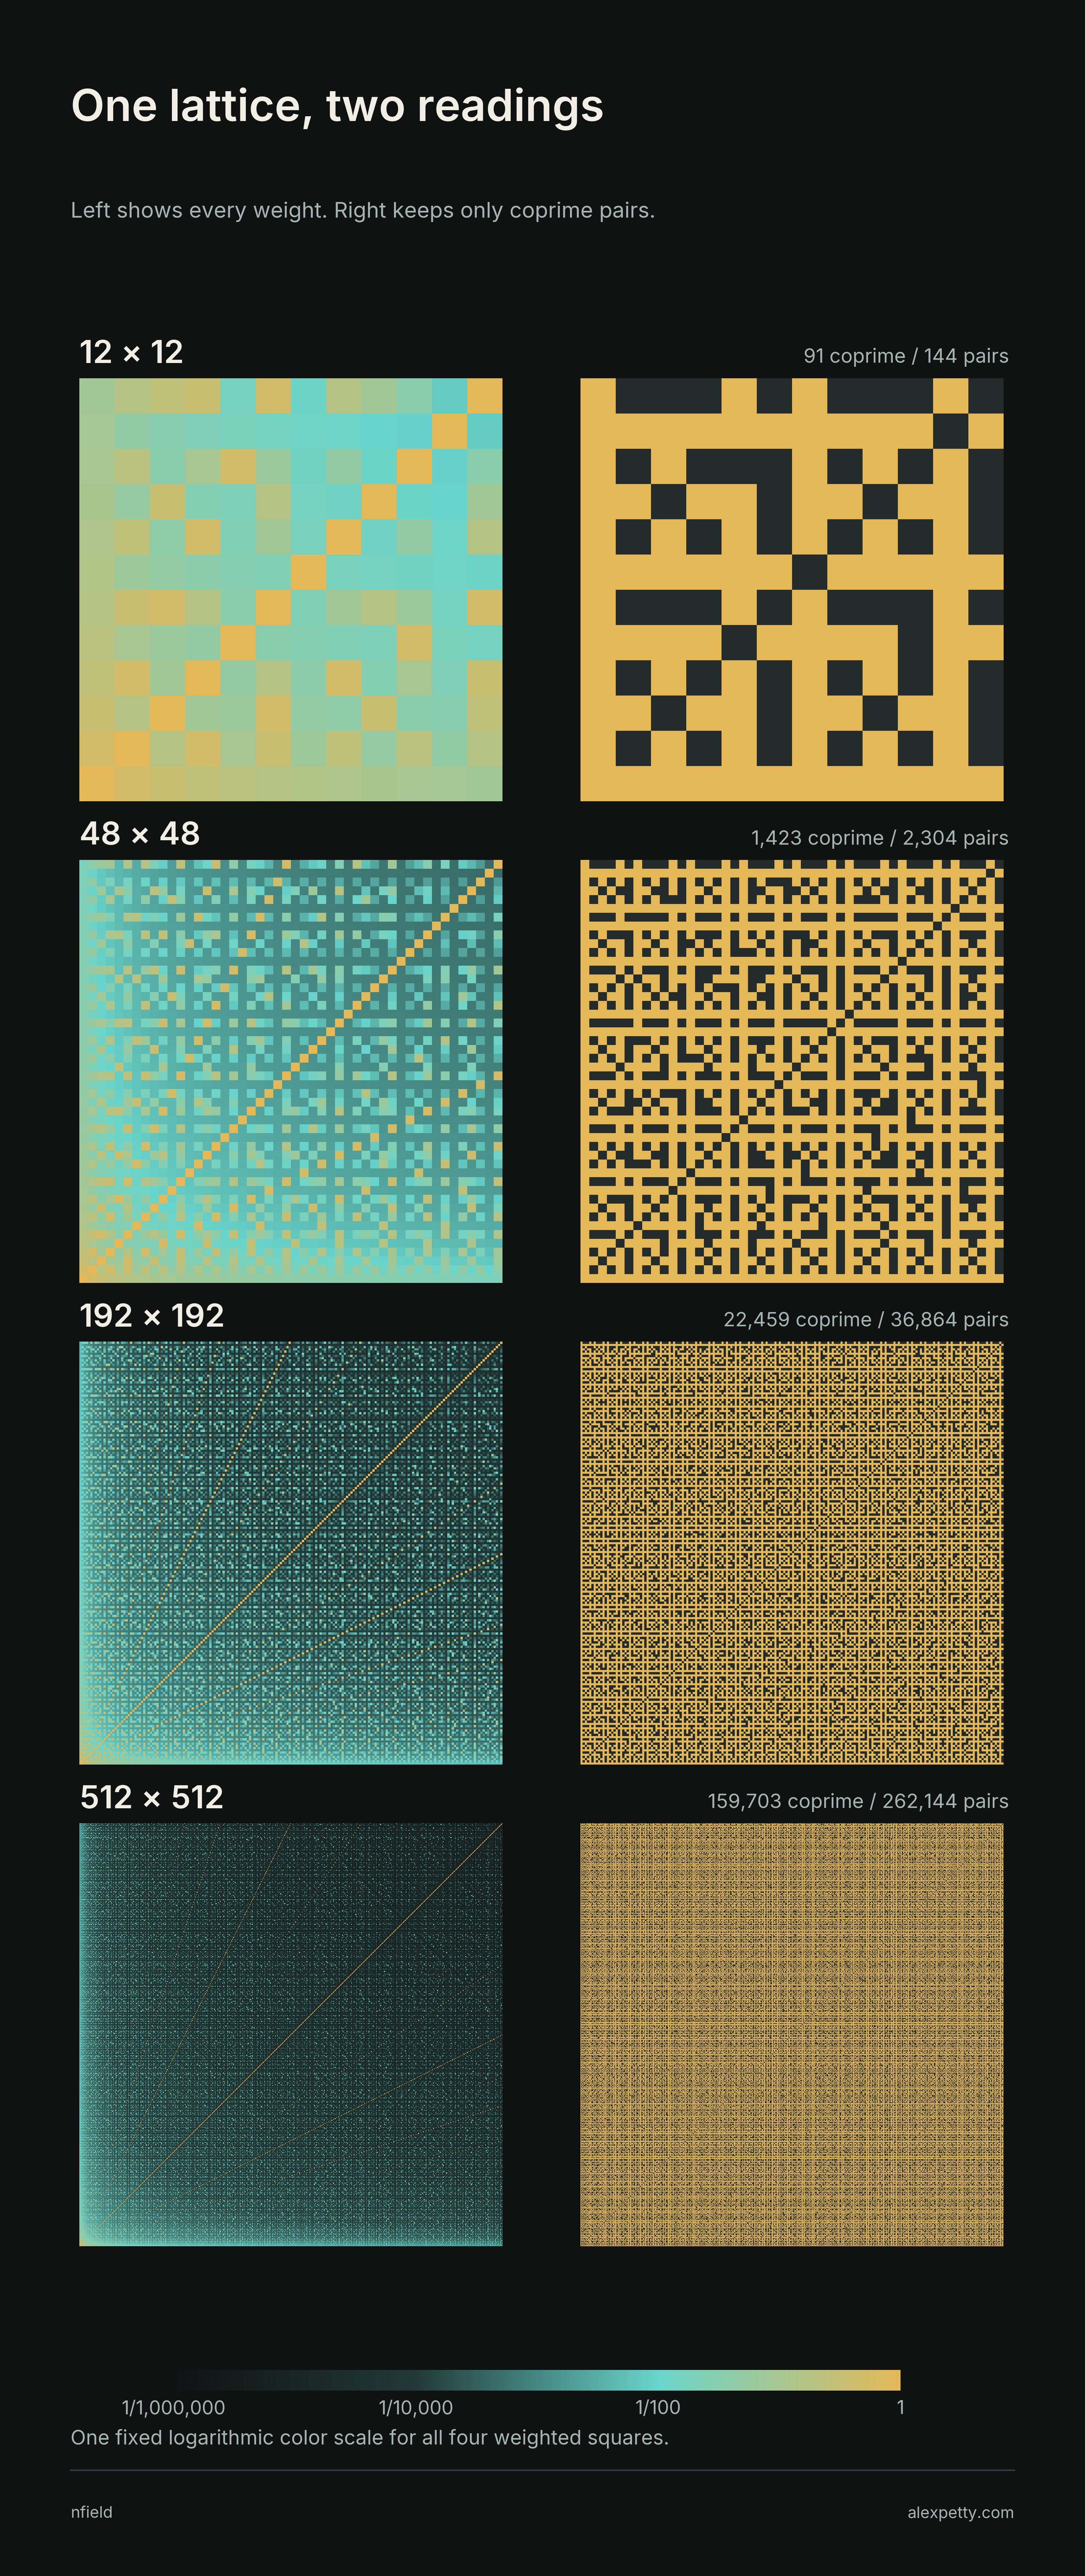
The left squares show every weight in the continuous pair table. Each bright ray follows scaled copies of one reduced ratio. The right squares retain only the pairs with no common factor. Compare the two views at the same size, then follow how their patterns develop as the square grows. Every one of the 262,144 cells is present in each largest panel.
Two orientations for each pair, half a copy lost on average, another half from adding up the logarithms, and the coprime share.
That is the second coefficient of a classical sum, the sum of greatest common divisors over least common multiples across an by square.
Hilberdink, Luca and Tóth proved the leading term and bounded the rest by a constant times . The constant inside that bound is . The collision energy divides this table by three, so its own coefficient is .
The pair count behind the coefficient
The continuous weight is . Let be its sum over the square . At width four,
| Row / column | 1 | 2 | 3 | 4 |
|---|---|---|---|---|
| 1 | 1 | 1/2 | 1/3 | 1/4 |
| 2 | 1/2 | 1 | 1/6 | 1/2 |
| 3 | 1/3 | 1/6 | 1 | 1/12 |
| 4 | 1/4 | 1/2 | 1/12 | 1 |
The sum is . Put . Counting each reduced pair and its whole copies gives
Replacing the floor by the quotient exposes the rounding loss. The exact deficit consists of twice
and a positive missing-pair tail of size .
Möbius inversion contributes . The weighted fractional-part theorem of Saffari and Vaughan contributes a mean one half, and harmonic summation contributes another half. Two orientations give
The continuous energy divides this table by three, leaving . Precisely,
Hilberdink, Luca and Tóth prove the classical leading estimate with an remainder. The result here identifies its leading correction. The fractional-part averaging is weighted, not ordinary uniform distribution.
Twenty-five readings of one curve
So far the correction belongs to a smooth average. The digit table is not smooth. It reads certain positions and nothing in between.
The connection between the two is exact. Each remainder pattern rises and resets, a sawtooth. Add the sawteeth for a base, double the result and square it. The collision energy of base five is precisely this curve read at twenty-five evenly spaced points and added up. One multiplication, by one minus the base, lines the carry table up with the readings, and no approximation enters anywhere.
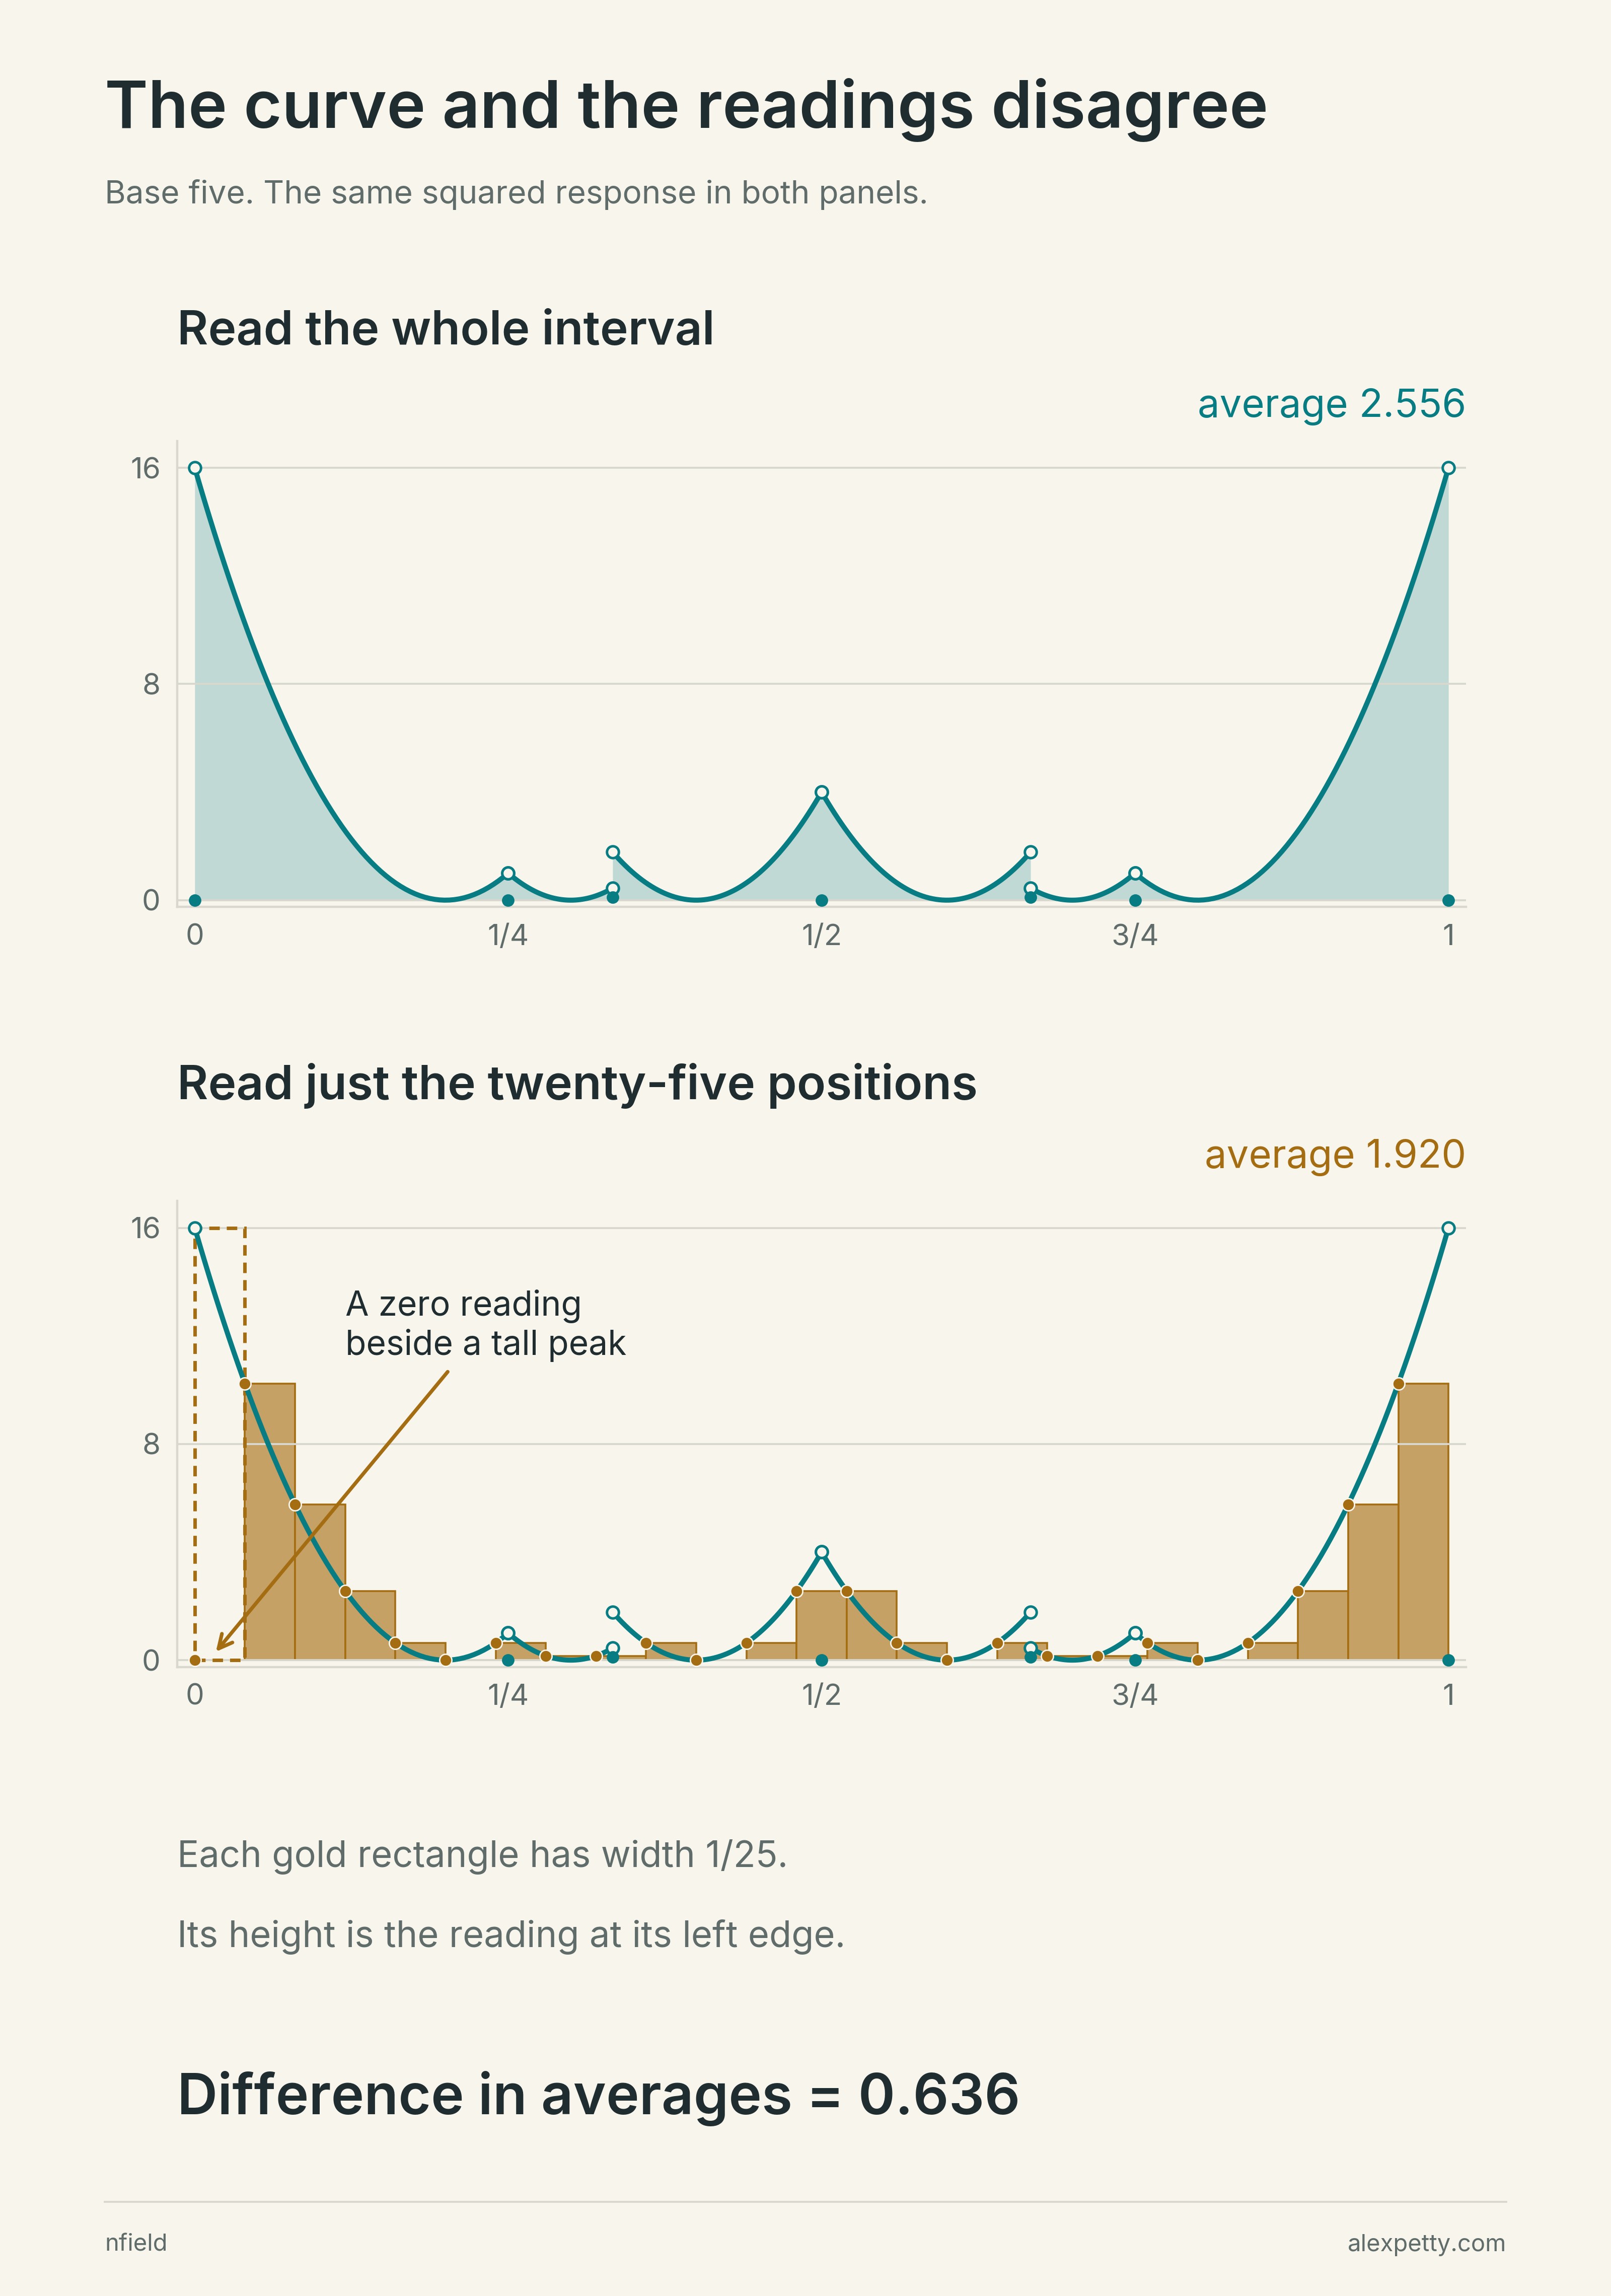
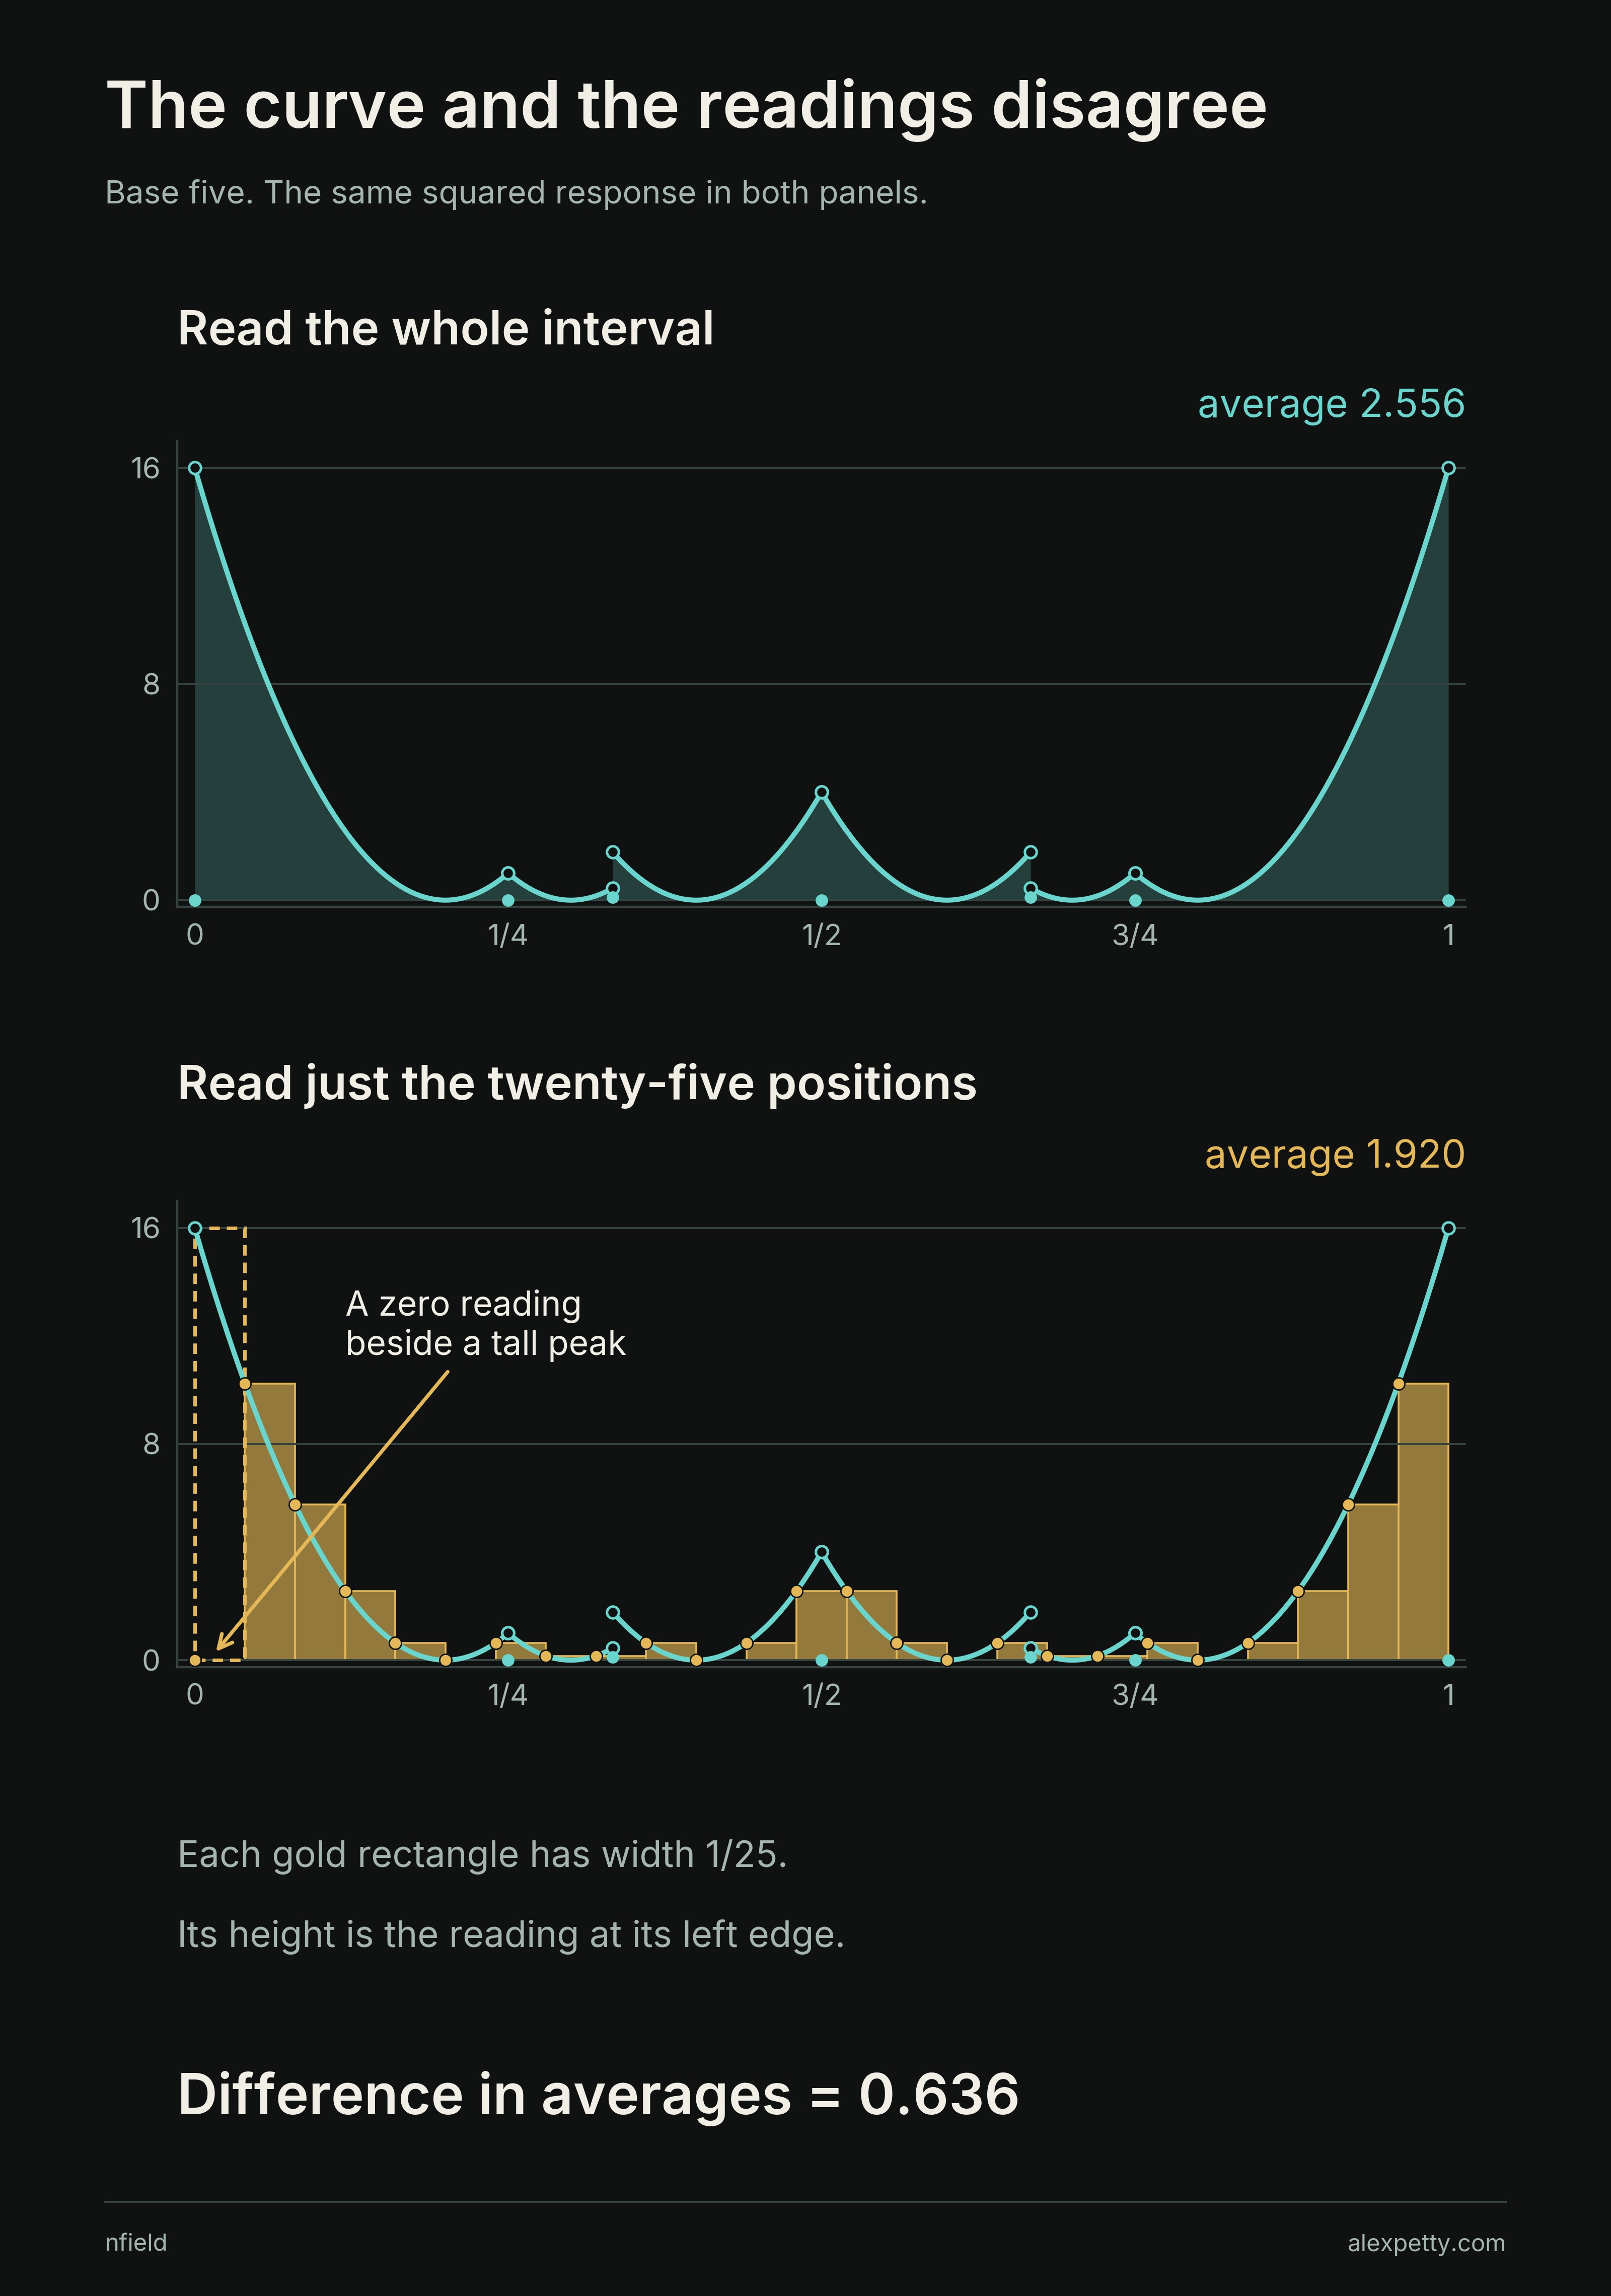
The smooth curve averages . The twenty-five readings average . They differ by exactly , and that difference is the sampling defect.
Anyone who has watched a wagon wheel turn backward in an old film has seen what sampling can do. The camera catches the spokes at fixed instants, and a wheel rolling forward is recorded rolling back. The digit table catches its curve at fixed instants too, and the curve changes with the base. It grows more teeth and sharper peaks at the same pace the readings crowd together. Nothing obvious stops the grid from inventing a correction of its own at exactly the size of the one just found, and changing the coefficient.
Winning by a log log
The proof has to show that the grid’s error is smaller than . The first attempt only ties.
The defect has two exact descriptions. One follows the jumps of the curve and where they fall relative to the grid. The other, after Rademacher’s reciprocity, is a collection of Dedekind sums at smaller moduli. Bounding those sums by their sizes and ignoring their signs gives an error of order . That is exactly the size of the correction, and a tie proves nothing.
To do better the signs have to stay in. Each Dedekind sum opens, through a Fourier expansion, into a series of sawtooth values read at modular inverses. Lemke Oliver and Soundararajan meet the same series in their study of biases between consecutive primes. Korolev’s estimate for incomplete sums of inverses controls it. Composite moduli pay a price in divisors, and that price stays bounded on average. The saving is one factor of .
At base 10,007, is about 2.2. It is a thin margin, and it grows about as slowly as anything in analysis. But it grows without bound, and that is all the argument needs. The grid cannot reach the coefficient.
The exact bridge and the sampling theorem
Let away from integers and zero at integers. Put
Multiplication by permutes the residues modulo and gives
Consequently the two averages are
Their difference is . At five, the averages are and , with exact difference .
The uniform estimate is
One exact description keeps the jump sizes and their positions relative to the grid. Another uses Rademacher reciprocity and smaller Dedekind sums. Additive Fourier expansion opens the surviving term into centered inverse-residue series. Nonunit arguments descend to their actual moduli before Korolev’s incomplete-sum estimate is applied. Completion handles the remaining lengths, and bounded average divisor costs preserve the saving when the moduli are added.
The growing denominator in the bound makes the defect smaller than . The stronger logarithmic bound, boundedness and the conjectured limit remain open in this manuscript. None is needed to transfer the secondary coefficient.
So the shortfall has its law.
The ratio of the two sides tends to one. It describes large bases, and any one table can still sit well away from it. At base 10,007 the right-hand side is 860,845,875, a little more than half the actual shortfall. The remainder the theorem allows is smaller in the limit, but it is not yet small.
Finite values and the remainder in the theorem
| Base | Exact energy | Exact gap | First correction |
|---|---|---|---|
| 31 | 24,784 | 5,007 | 1,148 |
| 101 | 960,064 | 70,237 | 22,015 |
| 1,009 | 1,016,385,360 | 10,858,369 | 4,934,945 |
| 10,007 | 1,000,437,262,176 | 1,664,208,167 | 860,845,875 |
The energies are exact finite counts. The correction column uses natural logarithms and is rounded for display. The calculation covers every odd prime through 1,009, followed by the declared checkpoints 1,201, 2,003, 3,001, 4,001, 5,003, 7,001 and 10,007. These finite checks do not prove the limiting ratio.
The full statement is
The error estimate is asymptotic. It does not specify a usable numerical error constant at one small base.
Four worked diagrams
The copy count, common-factor filter and sampled curve can also be inspected in these annotated calculations.
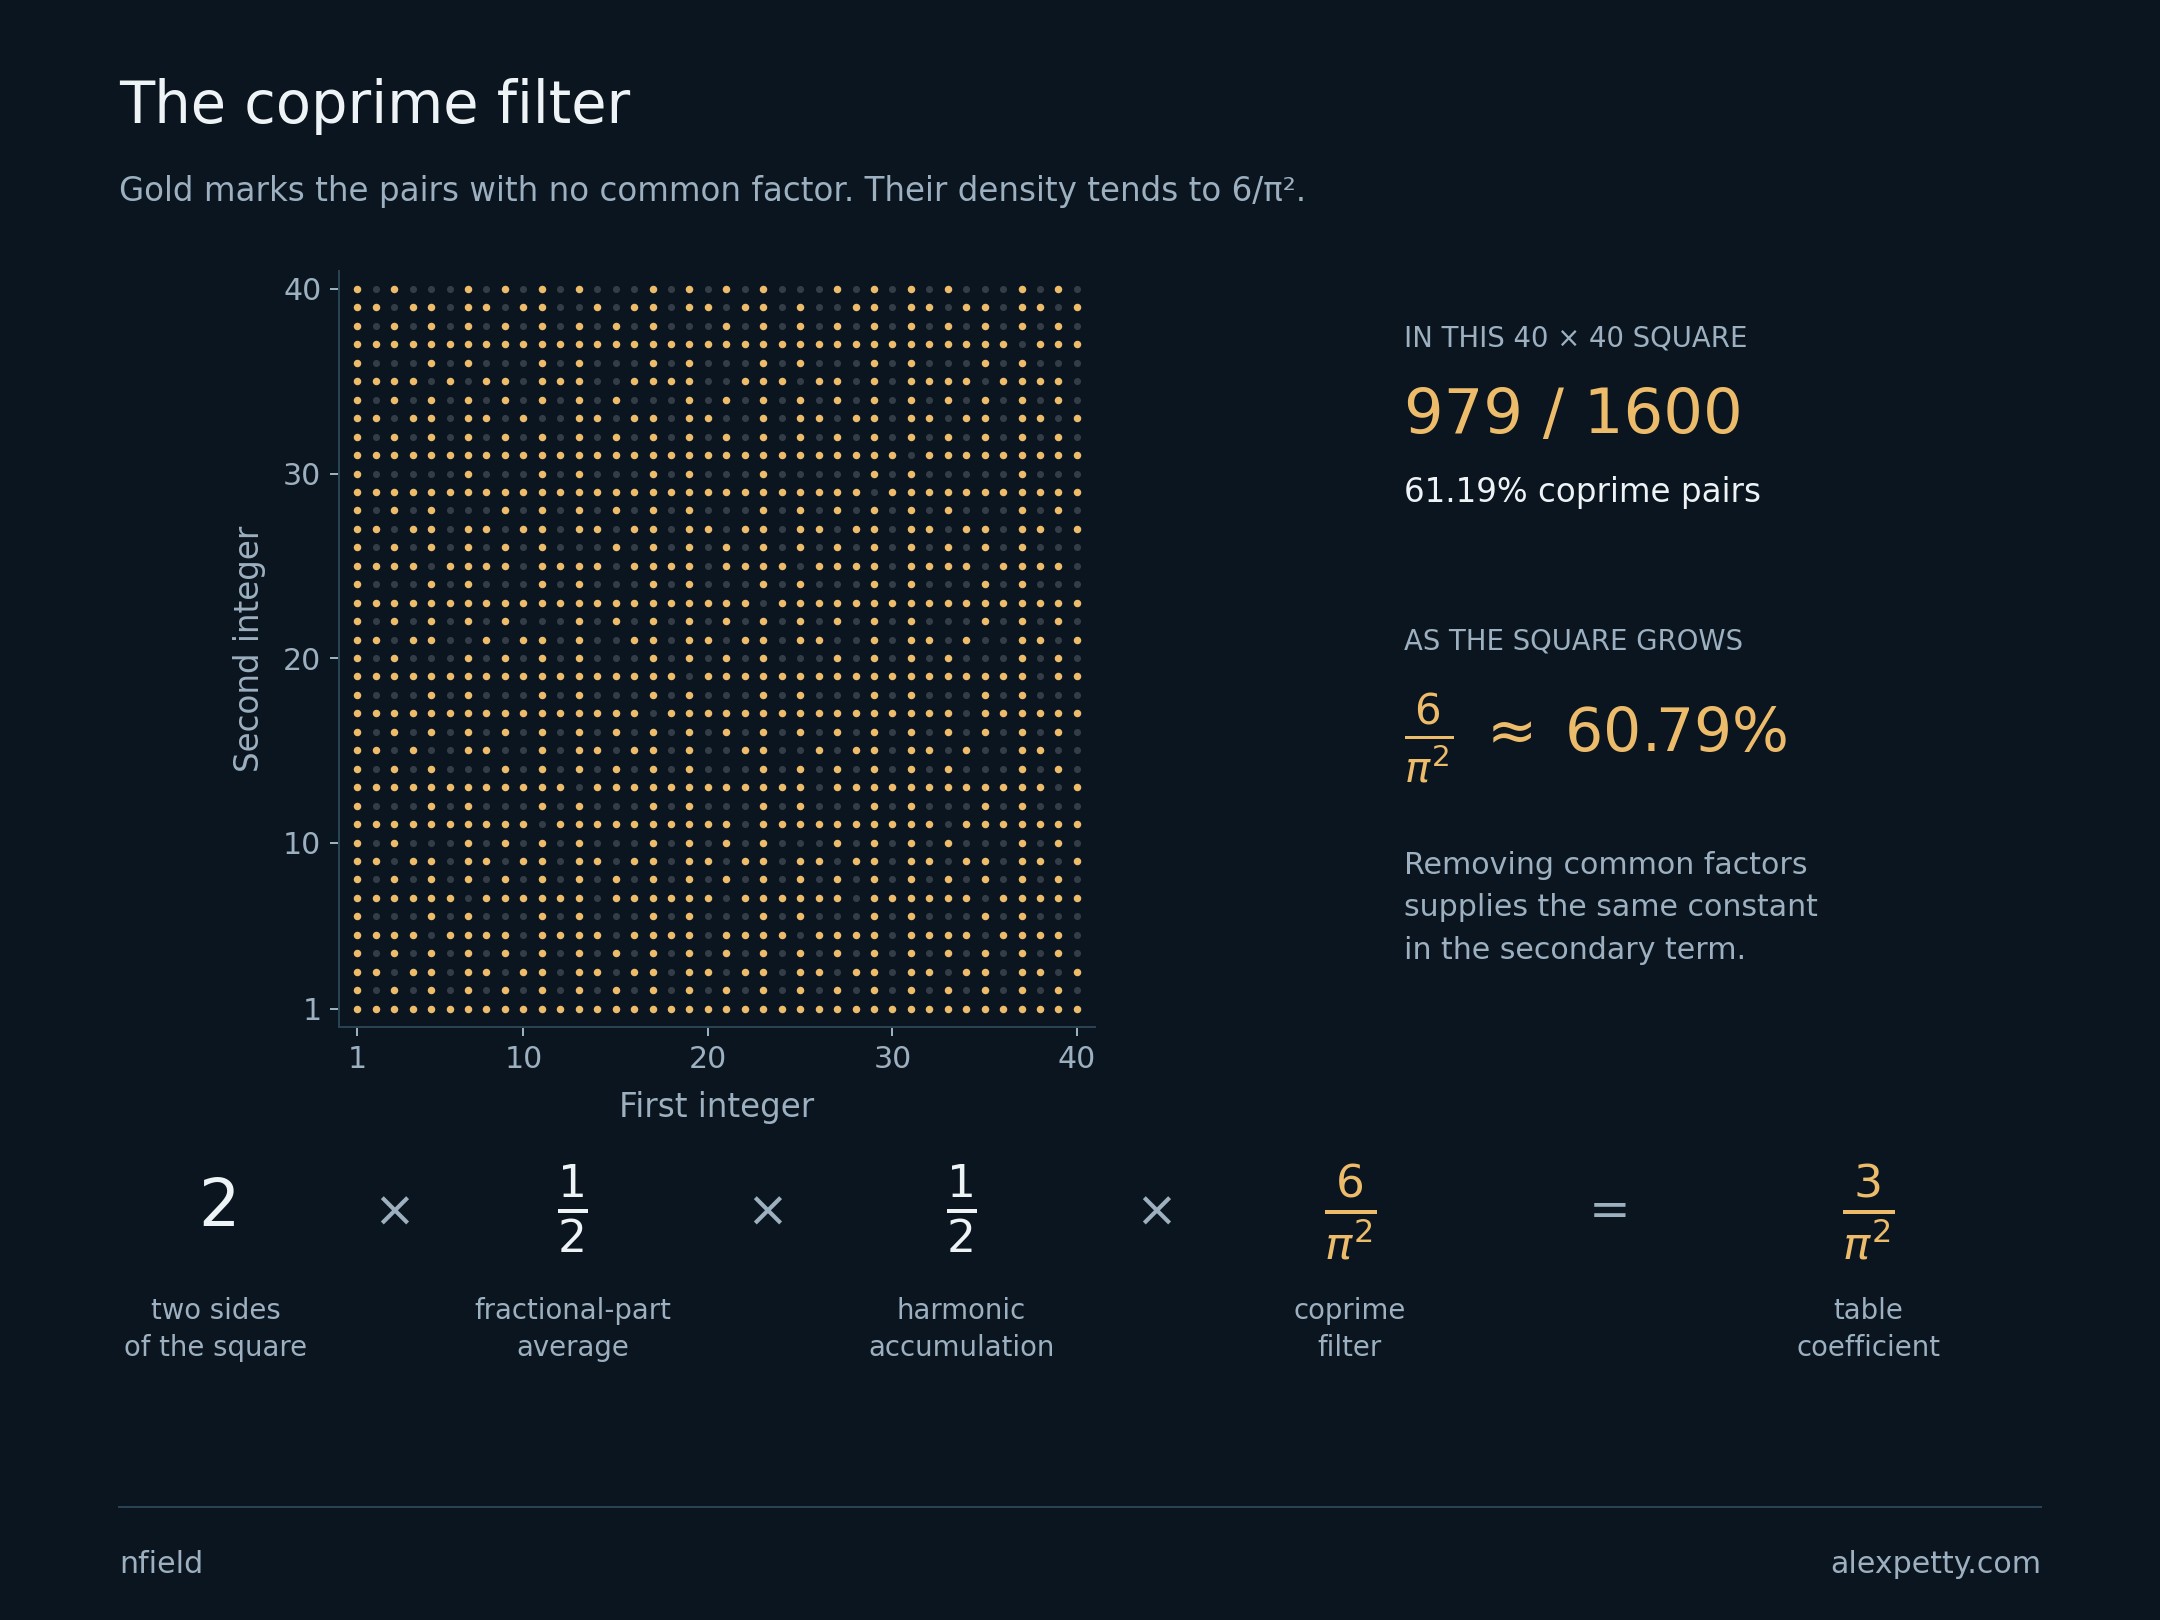
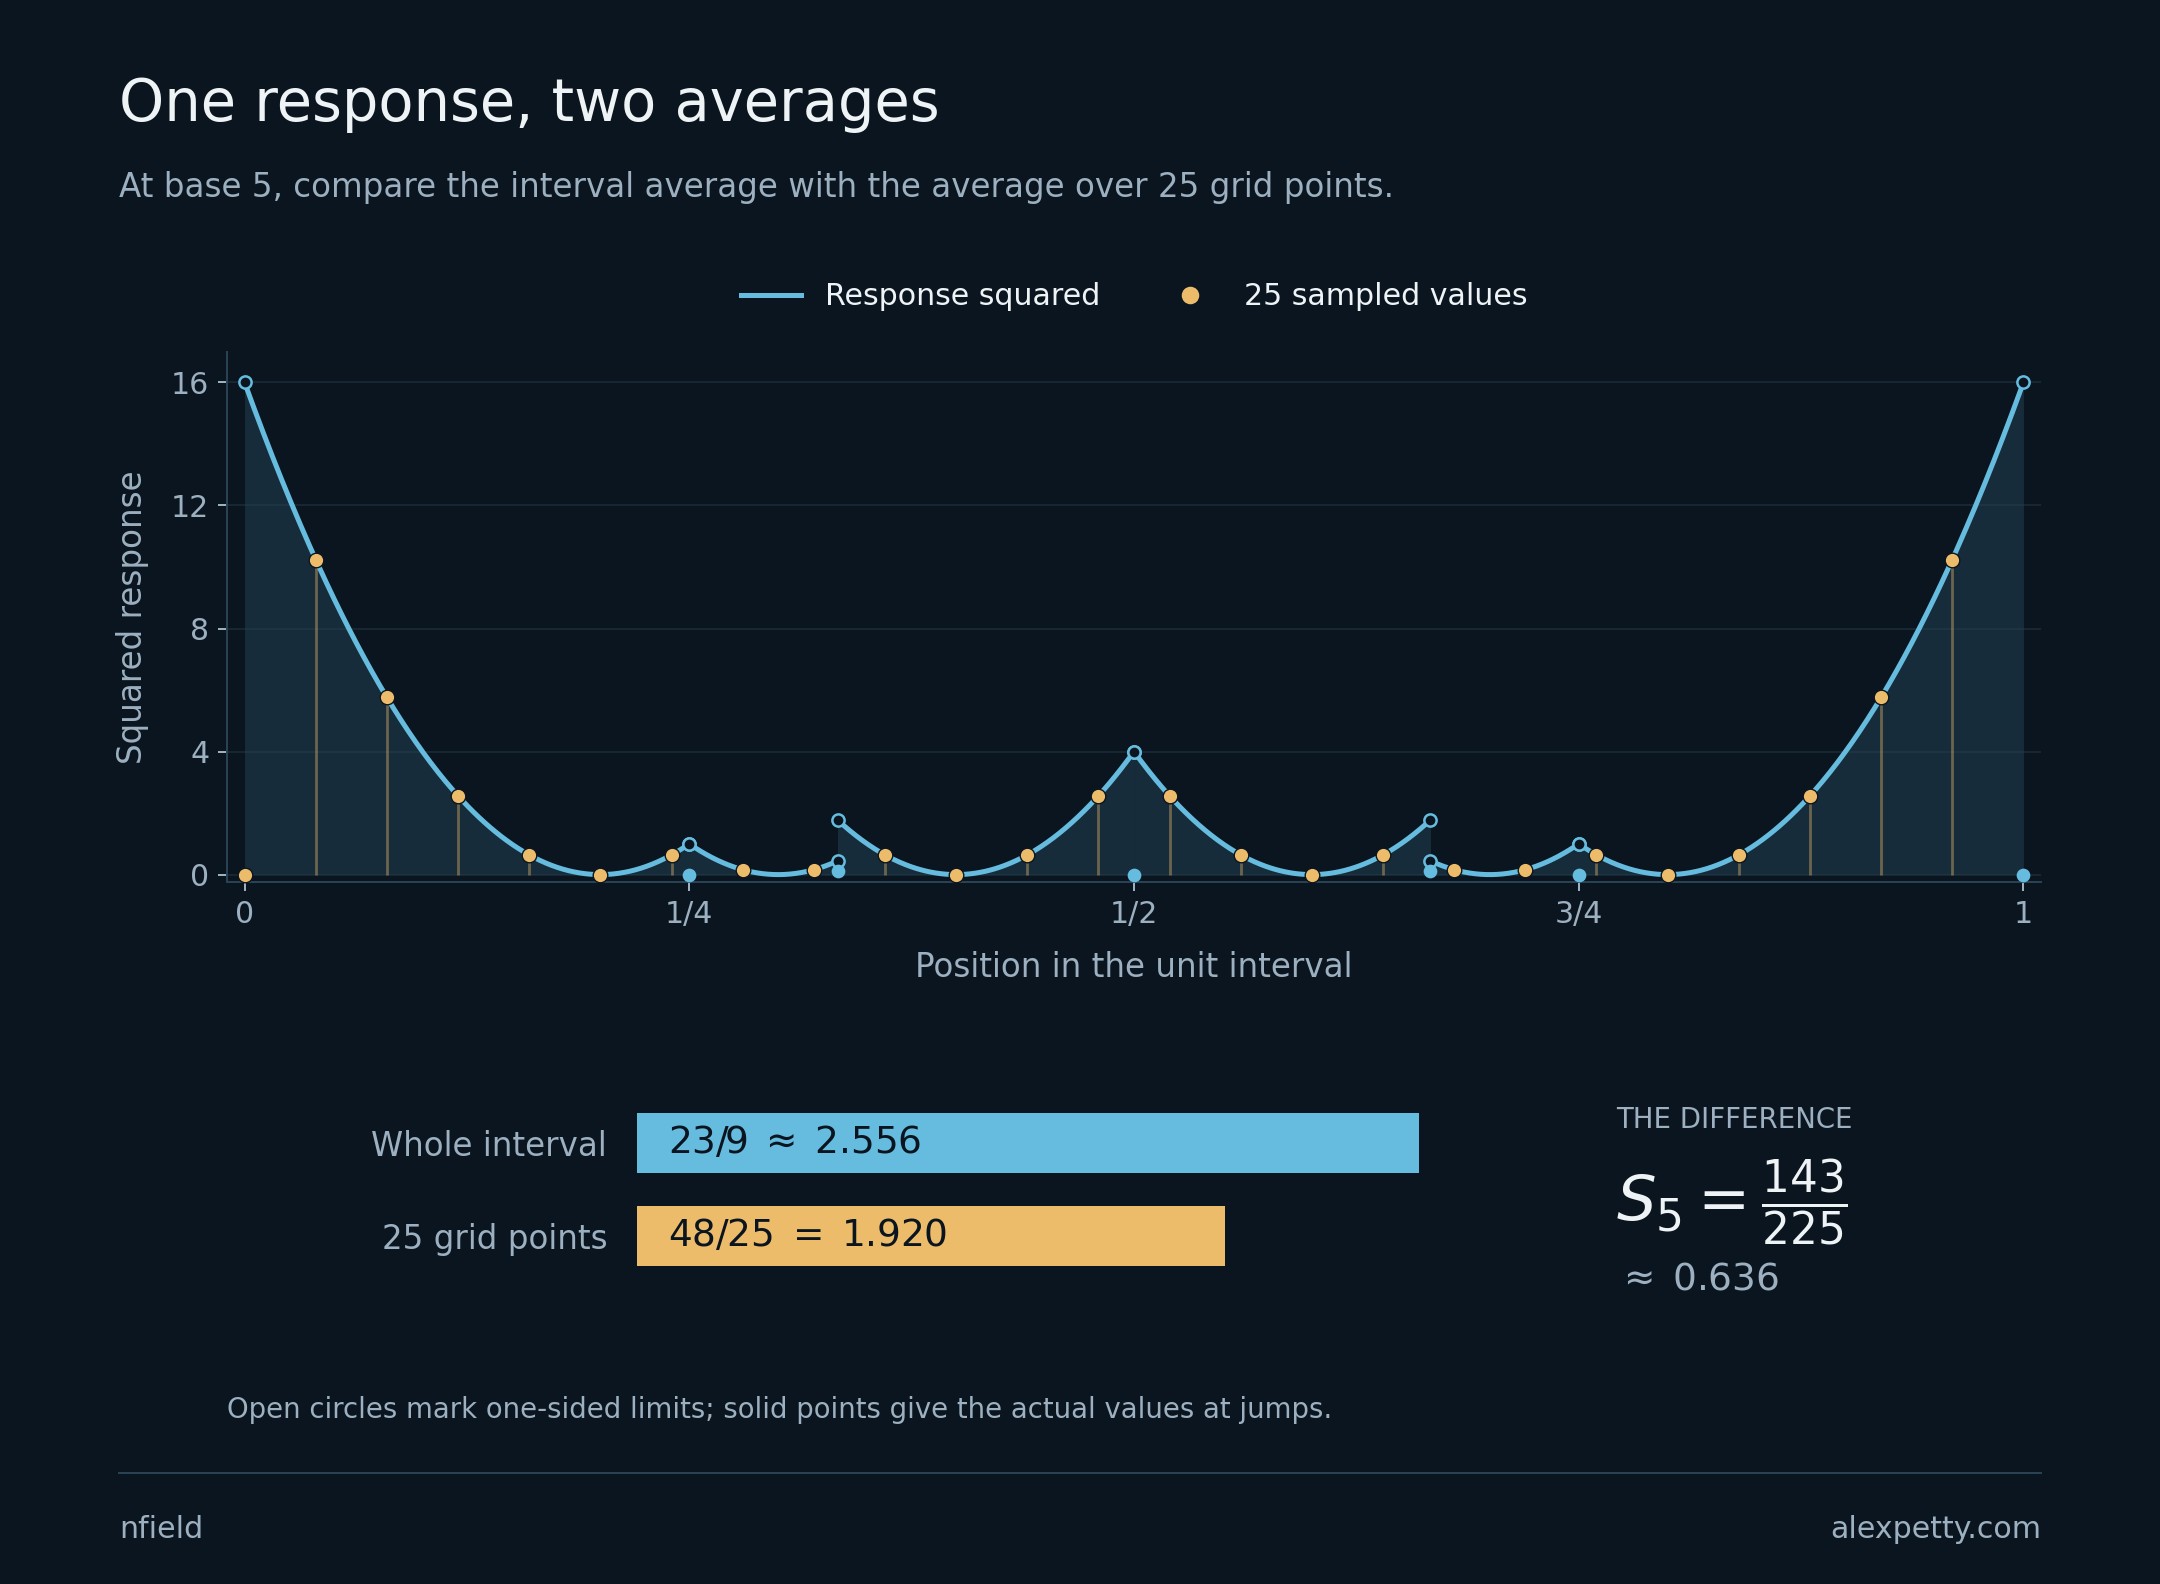
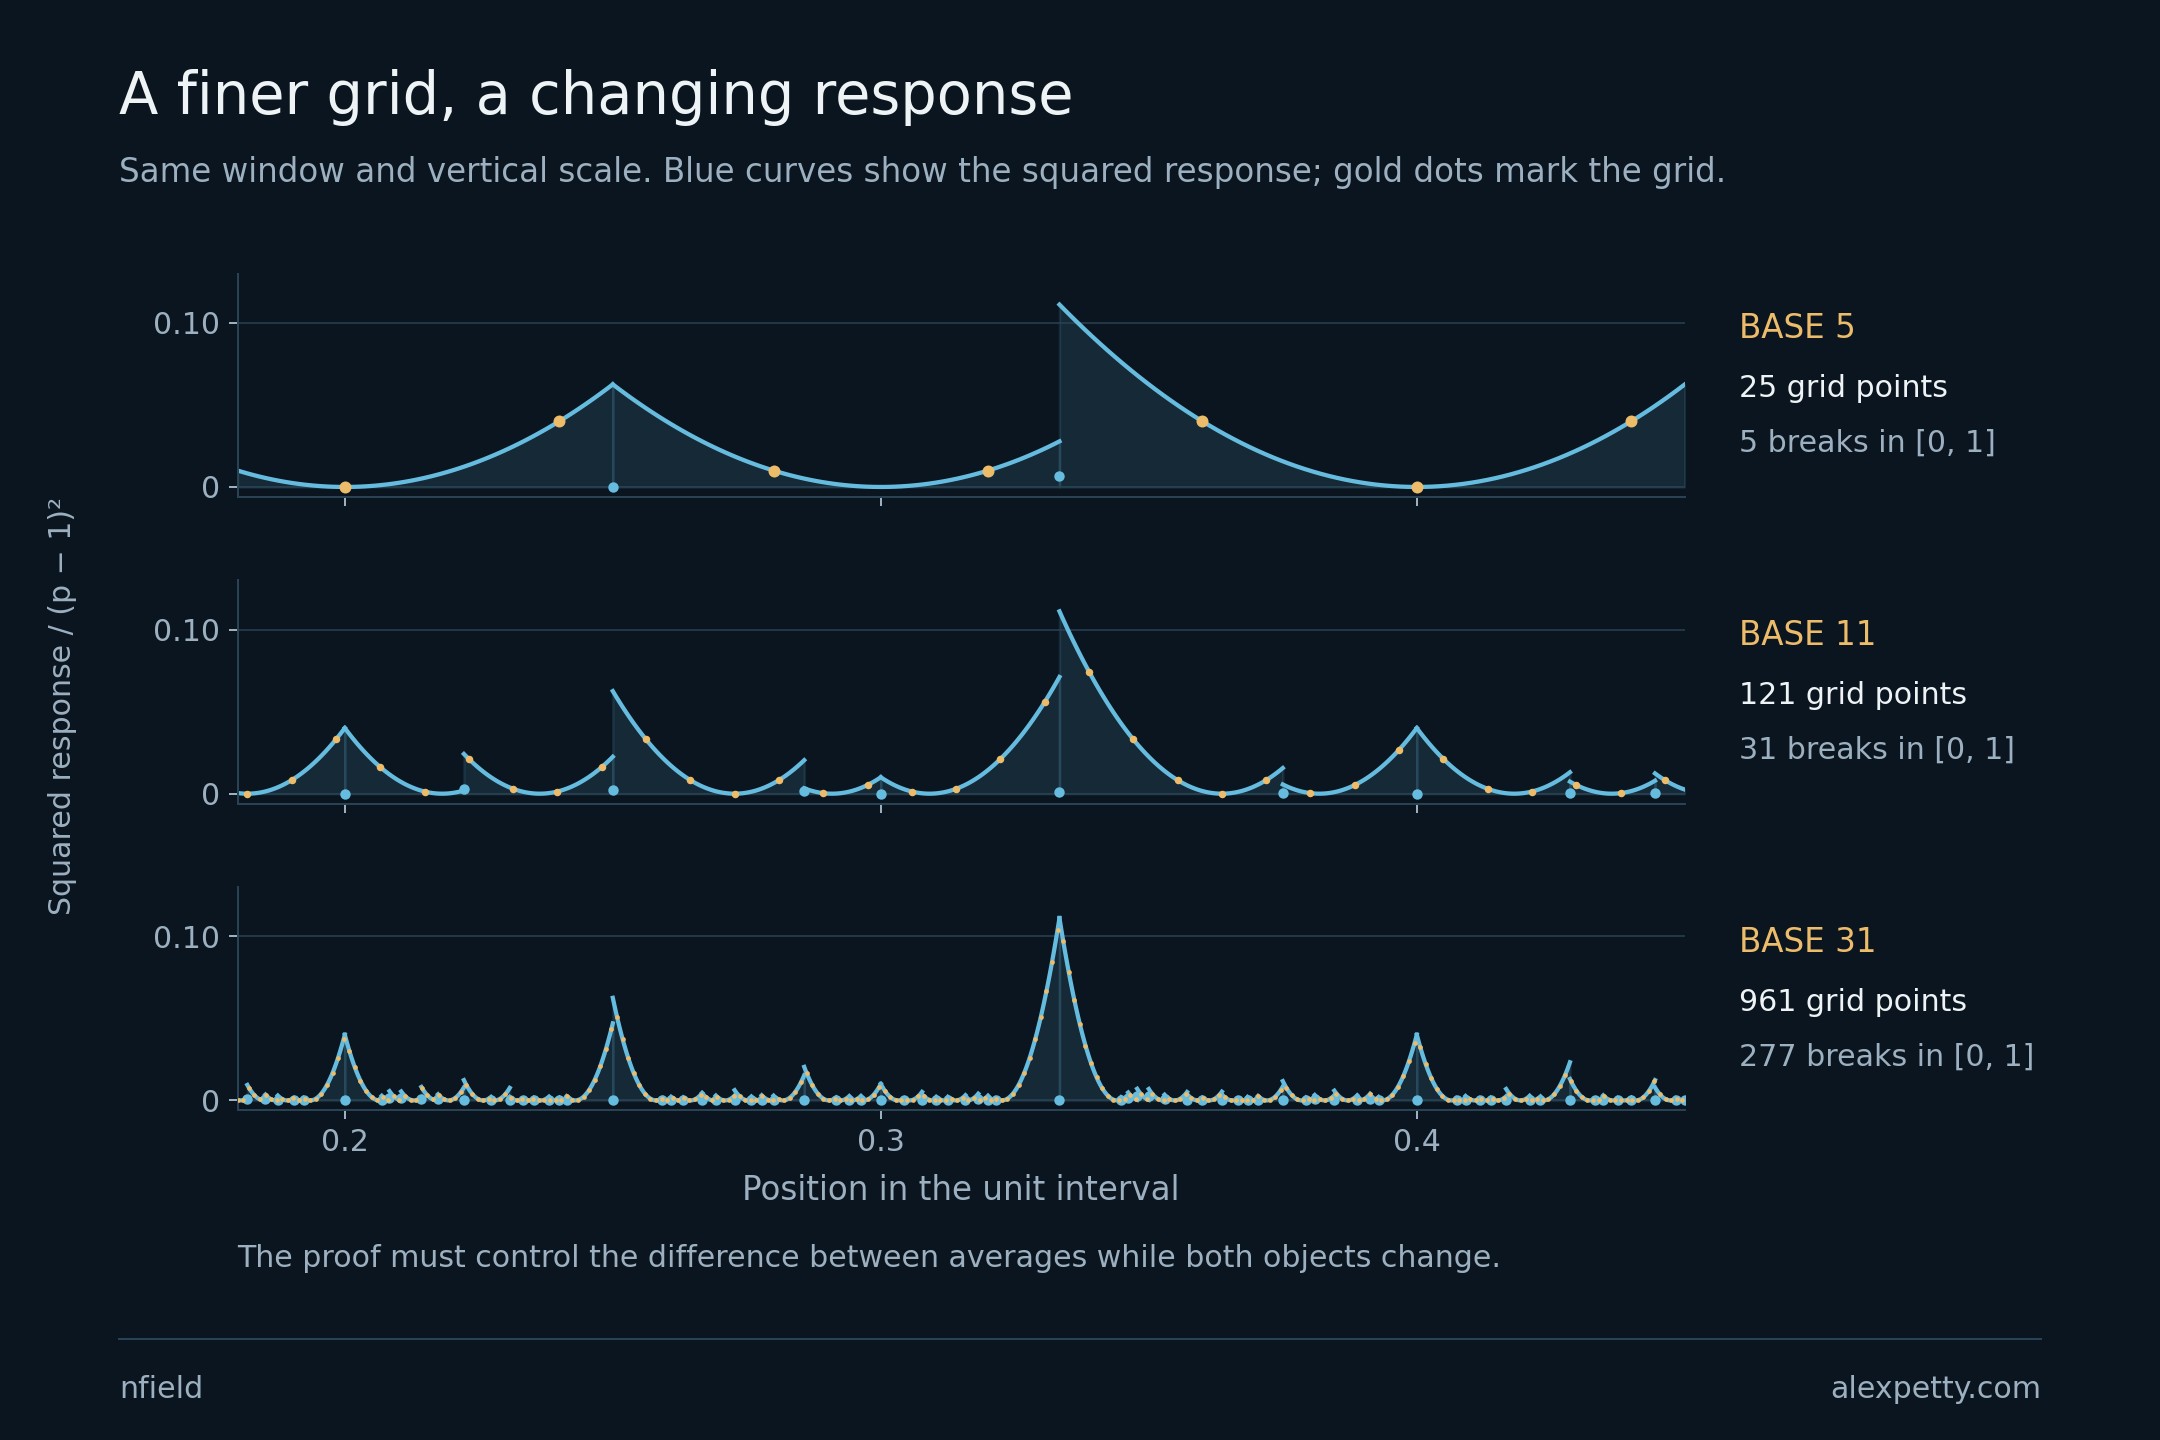
The full proofs are in The Secondary Term in Digit-Collision Energy.
One reading at zero
The theorem lets the sampling defect grow, slowly. The tables do not let it move much at all. These values come from exact integer floor counts in nfield.
  base     defect     endpoint
    31    0.951176    0.936524
   101    1.026972    0.980296
   199    1.058311    0.989975
   401    1.011478    0.995019
  1201    0.992167    0.998335
  4001    0.999951    0.999500
 10007    1.008630    0.999800
The endpoint column is a single term that the exact formula sets apart, and it has a plain meaning. At zero the squared curve stands at its full height on both sides, and the grid takes its reading exactly there and records zero. It is the dashed box at the left edge of the base-five picture, a zero reading beside a peak of sixteen. That one missed reading costs , which tends to one.
If the defect tends to one as well, then the reading at zero is the grid’s entire lasting cost, and everything else it does cancels. The tables sit within a few percent of that, first above and then below. The proof says only that the defect is smaller than . There is a great deal of room between one and , and the tables keep landing near one.
The difference is now proved to tend to one. The common reset accounts for that unit, while the combined interior discrepancy vanishes. The calculation is developed in The Common Reset in the Cubic Law.
Discussion
Sign in to join the discussion.